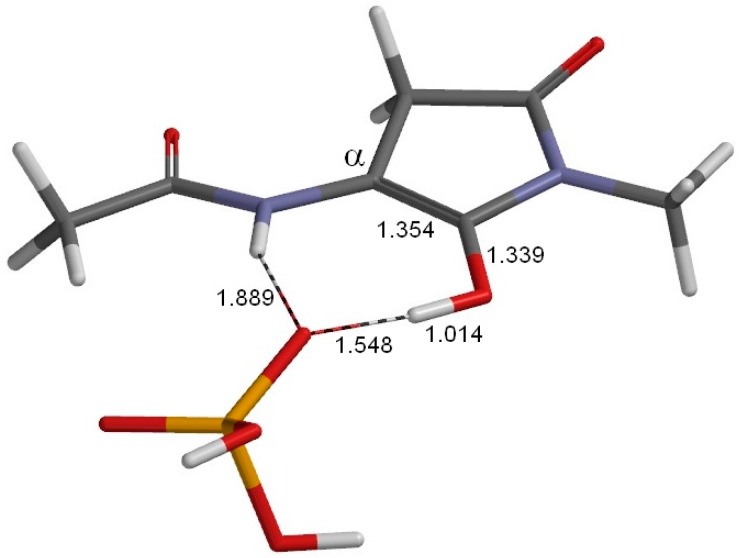
Figure 5.
The geometry of the first enol minimum EN1 (φ = −165°, ψ = −177°, χ1 = 177°). This is a complex between the enol form of the model compound and an H2PO4− ion, and lies between TS1 (Figure 4) and TS2 (Figure 6). Selected interatomic distances are shown in Å. Grey: carbon; white: hydrogen; blue: nitrogen; red: oxygen; orange: phosphorus.

