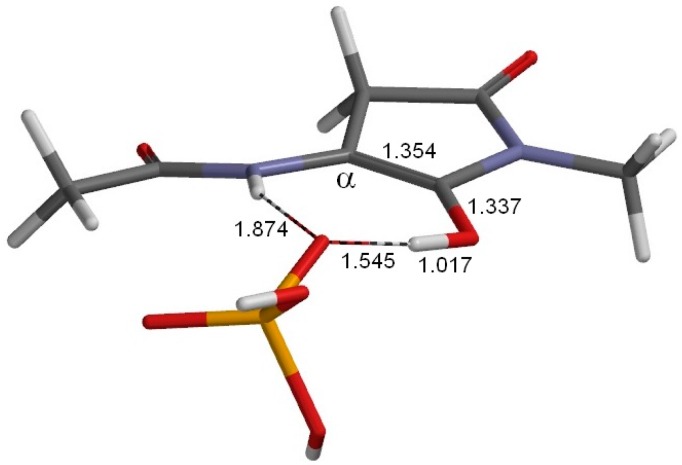
Figure 6.
The geometry of the second transition state TS2 (φ = −160°, ψ = −176°, χ1 = 176°). This transition state connects EN1 (Figure 5) and EN2 (Figure 7), and is for an OH rotation in the H2PO4− ion of the enol-H2PO4− complex. Selected interatomic distances are shown in Å. The imaginary frequency of this transition state is 131i cm−1. Grey: carbon; white: hydrogen; blue: nitrogen; red: oxygen; orange: phosphorus.

