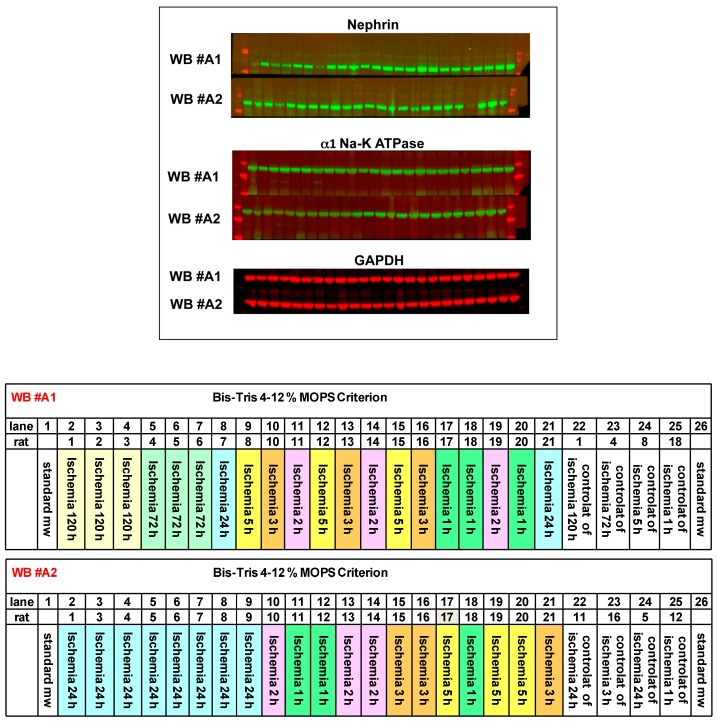
Figure 2.
Representative images of the Western blots for nephrin and α1 Na-K ATPase of the time course experiment. GAPDH was used as loading control. Standards of molecular weight are shown on the left and right in red (for nephrin: 250, 150 kDa; for Na-K ATPase: 100, 75, 50 kDa). Two gels are shown: WB #A1 and WB #A2 (26 wells). Lane legends are shown in the lower panel, each lane representing one rat.

