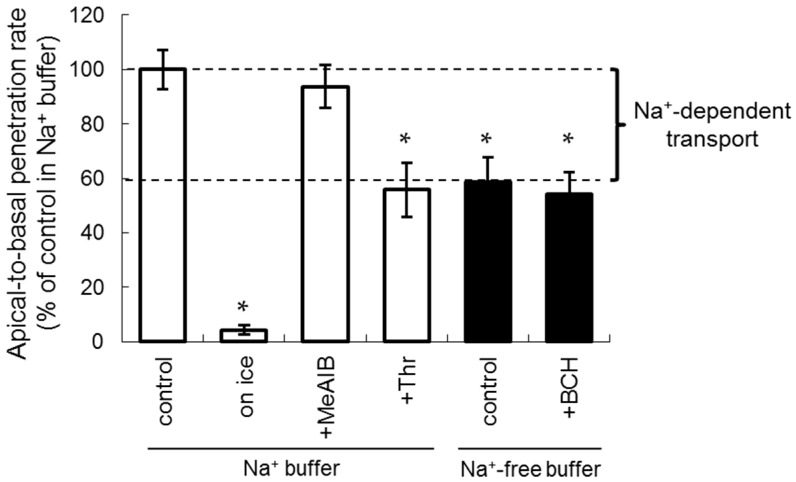
Figure 3.
The inhibition profile of [14C]fluciclovine (10 μM) apical-to-basal transport using the LLC-PK1 monolayer model under the indicated conditions, i.e., temperature and 1 mM inhibitors in Na+ buffer (white bar, n = 5–14) or Na+-free buffer (black bar, n = 9). Each data point represents the mean ± SD. * p < 0.05 vs control in Na+ buffer.

