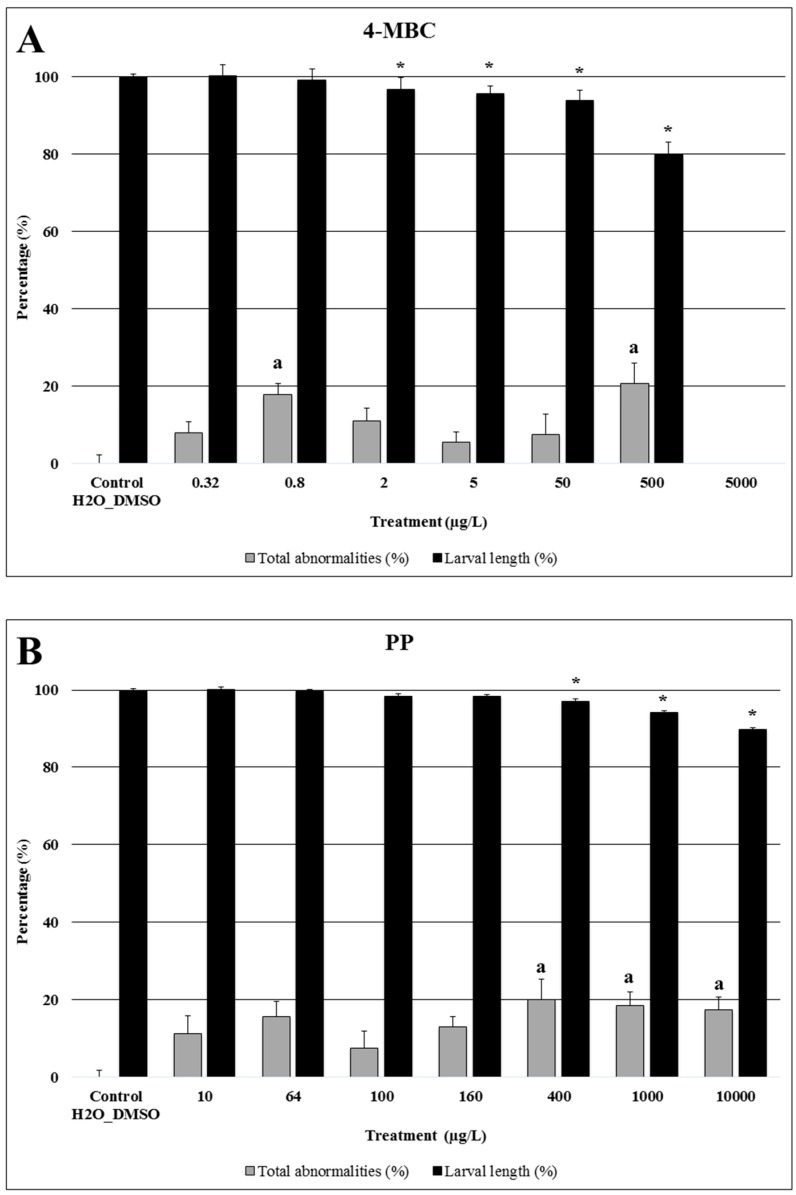
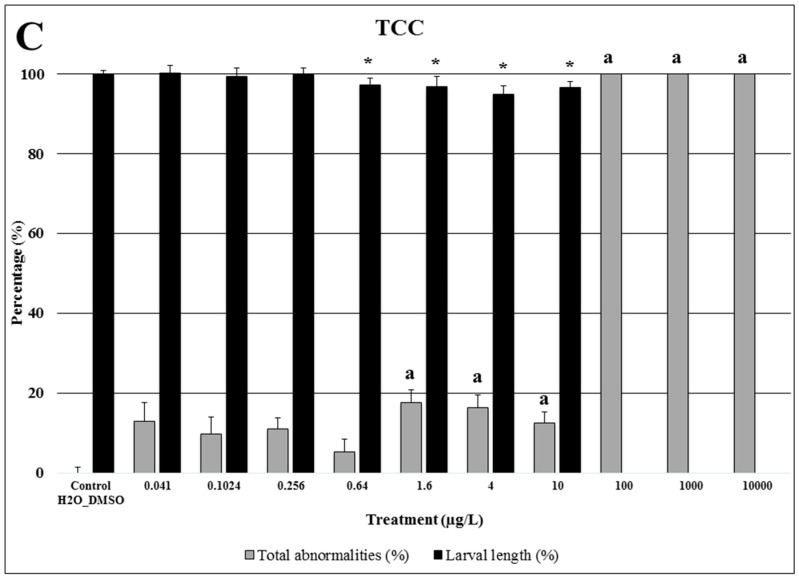
Figure 1.
Larval length (%) and total abnormalities (%) of Paracentrotus lividus exposed to different concentrations of 4-Methylbenzylidene Camphor (4-MBC) (A), propylparaben (PP) (B), and triclocarban (TCC) (C) for 48 h. Controls and solvent controls were grouped. Results of first and second assays are normalized to the respective control assay, for both endpoints. Bars with the letter (a) or the symbol (*) indicate significant differences from controls (p < 0.05). The percentage of larval length inhibition data are expressed as mean ± SE (n = 480 for controls; n = 240 for 5 µg/L 4-MBC, 1000 µg/L PP, 10 µg/L TCC and 0.64 µg/L TCC; n = 120 for the other groups). The percentage of total abnormalities data are expressed as mean ± SE (n = 32 for controls; n = 16 for 5 µg/L 4-MBC, 1000 µg/L PP, 10 µg/L TCC and 0.64 µg/L TCC; n = 8 for the other groups).


