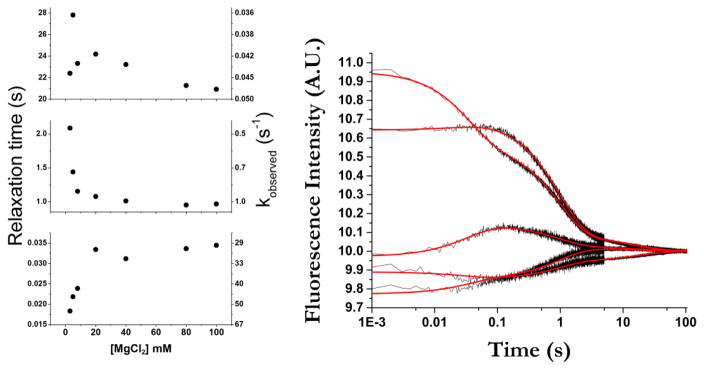
Figure 4.
Relaxation times and corresponding observed rates (1/τ) from global fits. Errors are contained within the data points. The scatter in the first points in the top plot is due to sparse sampling. An example of global fitting of stopped-flow traces for all 2AP-GAC molecules is shown for addition of 20 mM MgCl2. Black traces are data; red lines are fit. All progress curves and fits are shown in Supplemental Figures 2 and 3.

