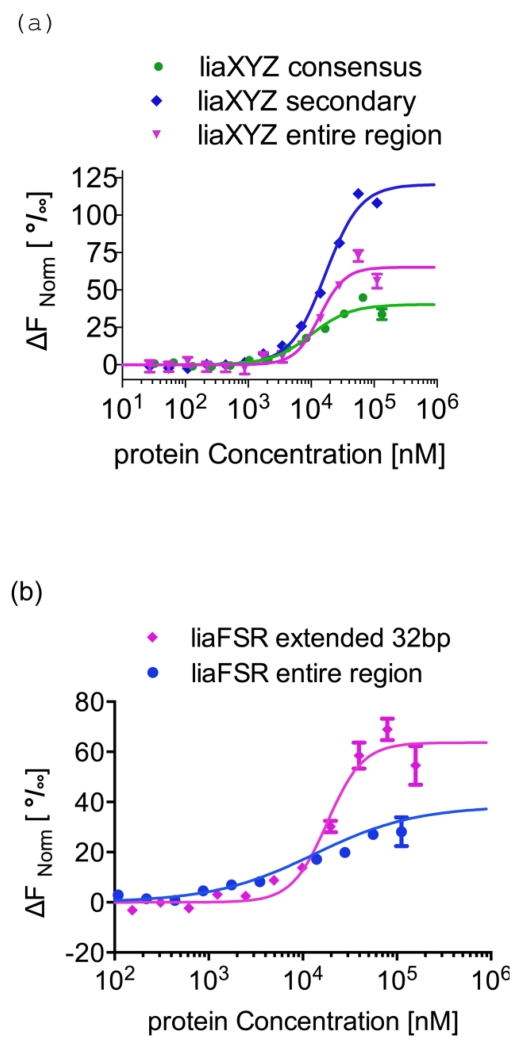
Figure 6. Adaptive mutant LiaRW73C that confers increased daptomycin resistance in E. faecium binds more tightly to DNA binding sites within the liaXYZ operon.
MicroScale Thermophoresis (MST) was used to measure the strength of Efm LiaR–DNA interactions. To determine the Kd, increasing concentrations of Efm LiaRW73C was added to 40 nM of fluorescently labeled DNAs (Supplementary Information). Fnorm was plotted on the y-axis in per mil [‰] unit (meaning every 1000) against the total concentration of the titrated partner on a log10 scale on the x-axis [45]. The resulting Kd values based on average from four independent MST measurements. Bars indicate the SEM (standard error of the mean)
(a) The binding of LiaRW73C to the consensus (green circles), secondary (blue diamonds), or entire protected region (magenta triangles) sequences within the liaXYZ operon. The DNA sequence for the entire protected region is shown in Figure 5b.
(b) The binding of LiaRW73C to the extended (32 bp, magenta diamonds) or entire (blue circles) protected regions of the liaFSR operon. The DNA sequence for the entire protected region is shown in Figure 5d.

