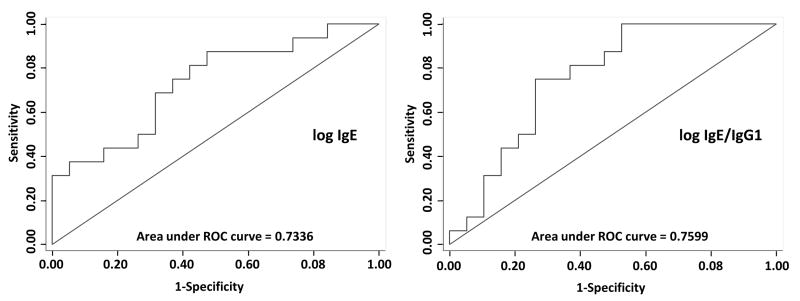
Figure 6. ROC Curves for IgE and IgE/IgG1 Ratio.
Receiver operator characteristic (ROC) curves for logistic regression models with IgE and IgE/IgG1 for the prediction of CTRCD. The area under the ROC curve (AUC) is 0.73 for the model with predictor of log2 IgE at baseline and 0.76 for the model with predictor of log2 (IgE/IgG1) ratio.

