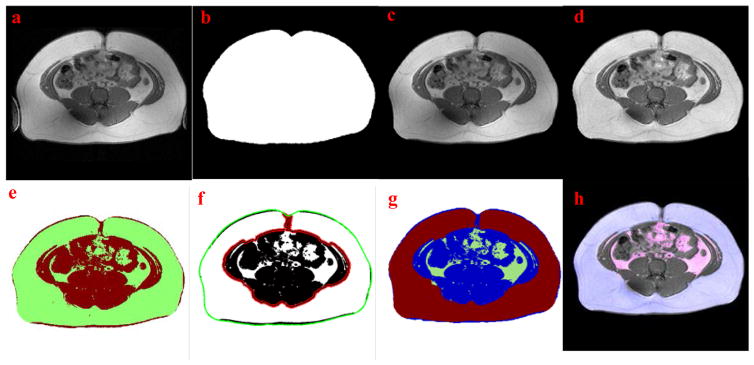
Figure 1.
Examples of the fully-automated fat assessment processing. (a) Original MRI slice with limbs on two sides. (b) Abdominal tissue mask after region growing. (c) Clean image with limbs removed by (b). (d) Intensity corrected image. (e) Discrimination of fat and non-fat tissue using FCM clustering. (f) Segmentation of VAT and SAT using active contour, the initial and final contour are marked with green and red lines, respectively. (g) Segmentation result: green - visceral fat, red - subcutaneous fat and blue - non-fat tissue. (h) Final assessment result (Overlaying segmentation result on original MRI slice): pink -VAT and blue- SAT.

