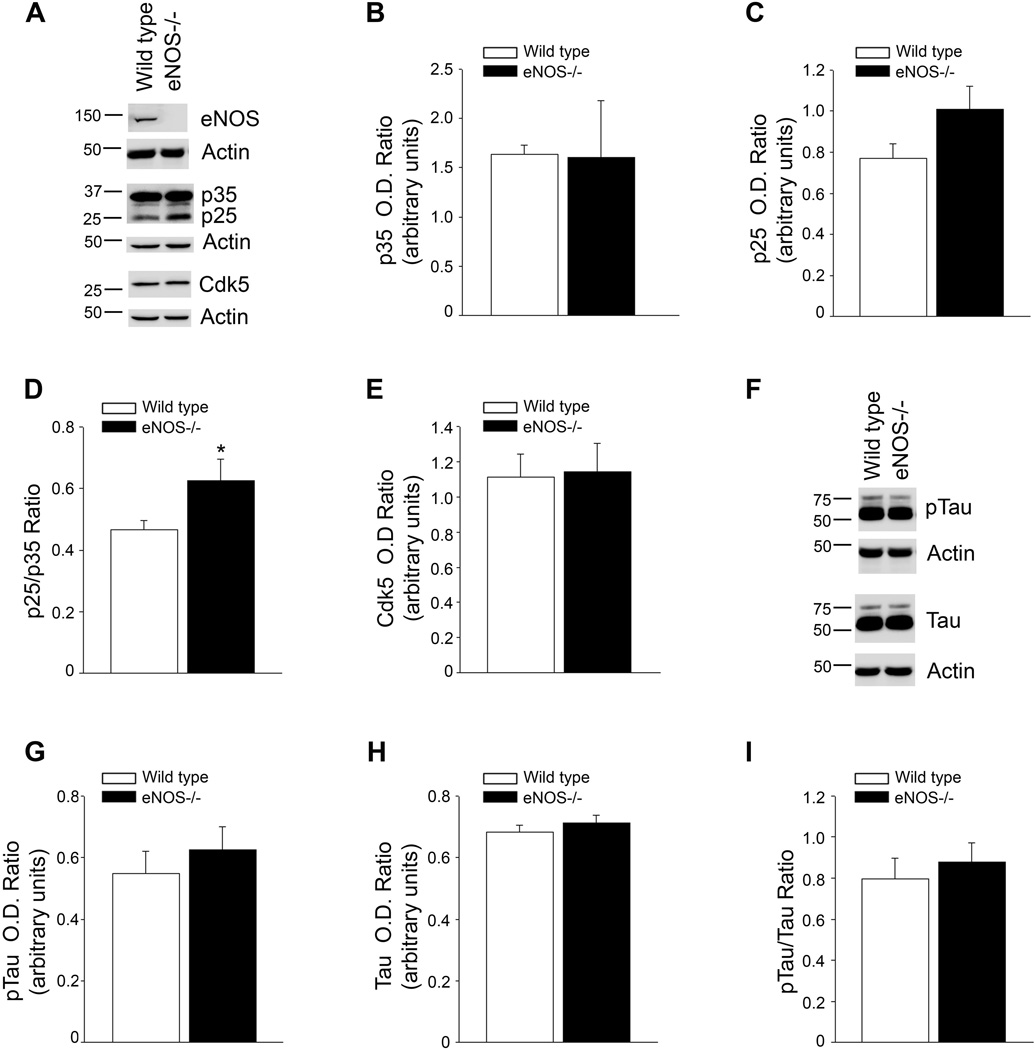
Figure 1.
p25/35 ratio is significantly higher in the brain tissue of eNOS−/− mice as compared to wild type although tau phosphorylation is unchanged. A, Brain tissue from 4 month old wild type and eNOS−/− mice was analyzed by Western blot. A representative image is shown. Densitometric analysis for B, p35, C, p25, D, p25/p35 ratio, and E, Cdk is shown. Data is presented as relative mean O.D. ± SEM (n = 8 animals per background, *P<0.05 from wild type). F, Brain tissue from 4 month old wild type and eNOS−/− mice was analyzed by Western blot. A representative image is shown. Densitometric analysis of G, pTau, H, tau, and I, pTau/tau ratio, is shown. Data is presented as relative mean O.D. ± SEM (n=8 animals per background).

