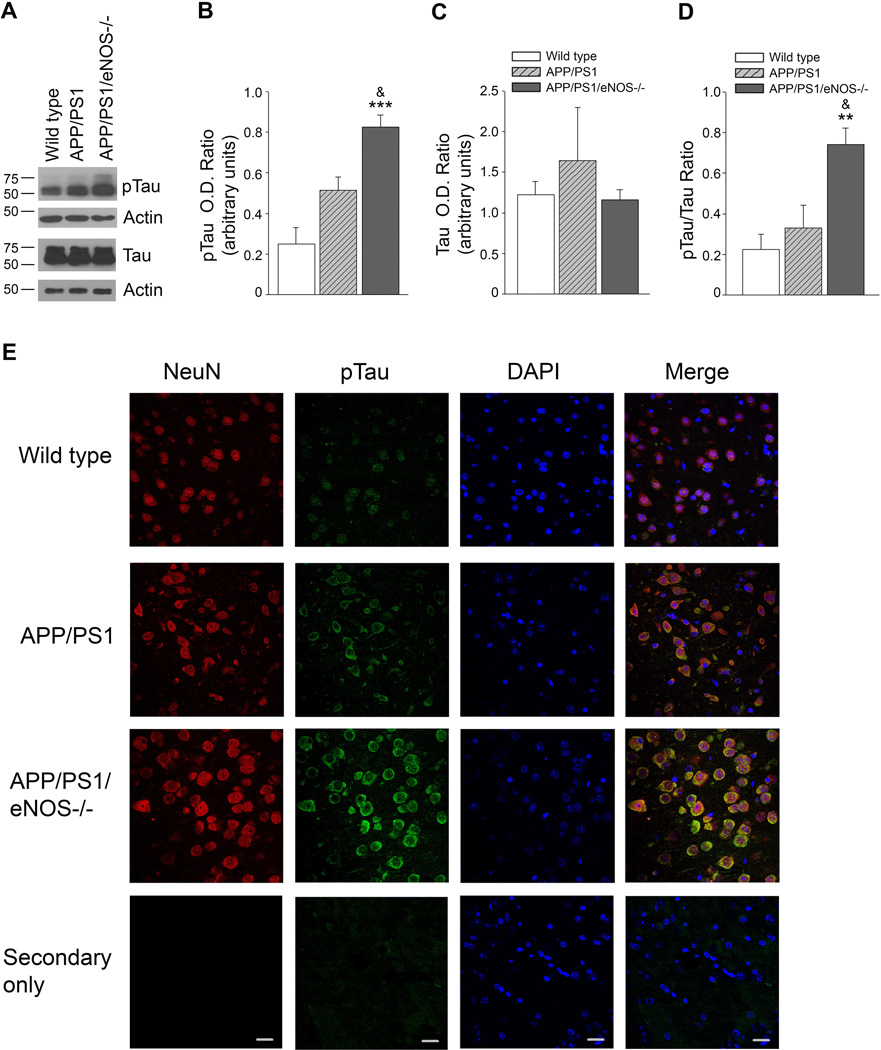
Figure 4.
pTau and pTau/Tau ratio are significantly increased in the brain tissue of APP/PS1/eNOS−/− mice as compared to both APP/PS1 and wild type mice and pTau is localized to neuronal tissue. A, Brain tissue from 4–5 month old wild type, APP/PS1, and APP/PS1/eNOS−/− mice was analyzed by Western blot. A representative image is shown. Densitometric analysis for B, pTau, C, tau, D, pTau/tau ratio, and is shown. Data is presented as relative mean O.D. ± SEM (n = 4 to 6 animals per background; **P<0.01, ***P<0.001 from wild type, & P<0.05 from APP/PS1). E, Fixed tissue sections from the brains of wild type, APP/PS1, and APP/PS1/eNOS−/− animals were immunolabeled with anti-pTau (with an anti-rabbit IgG FITC secondary) and anti-NeuN Alexa Fluor 647 conjugated primary. 4’,6’-diamiddino-2-phenylindole dilactate (DAPI) to visualize nuclei. Representative images of the cortex are shown. Magnification 40×; bar is representative of 20 µm.

