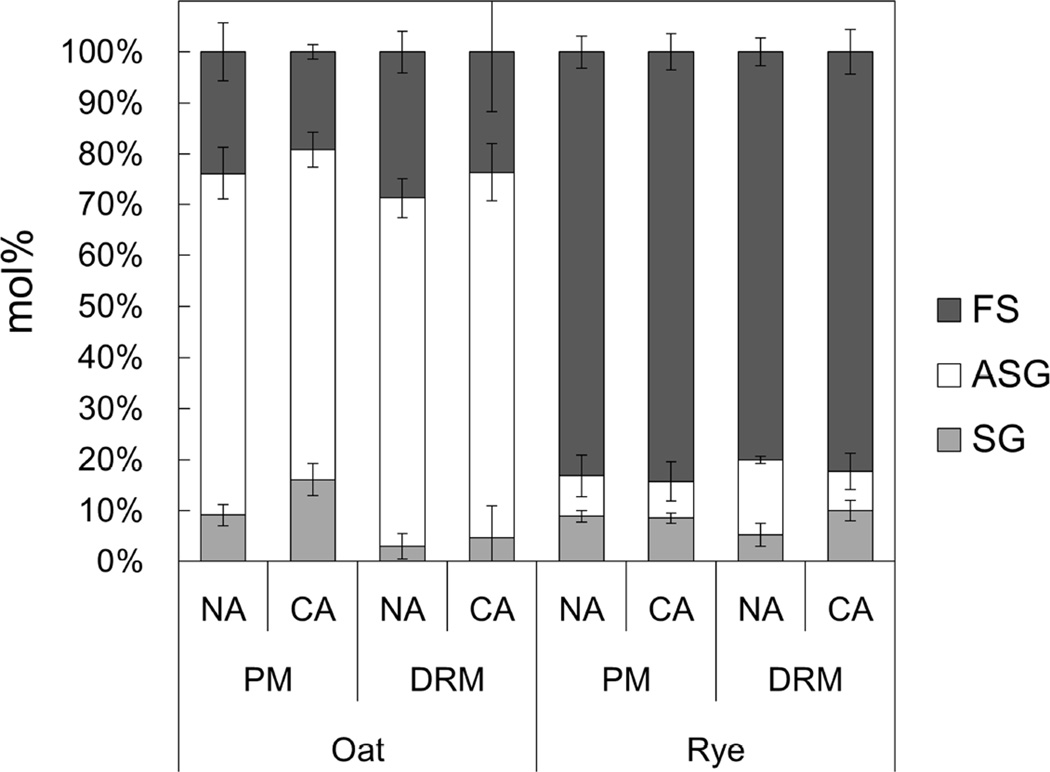
Fig. 2. Sterol compositions of PM and DRM fractions in oat and rye.
Sterol compositions of PM and DRM were quantified and Y-axis of the graph is mol% of each sterol in the total sterol content. The content of each group was determined colorimetrically after TLC, as shown in Fig. 1. Error bars indicate standard deviations (n=3–5). FS, free sterol; ASG, acylated sterylglycoside; SG, sterylglycoside.

