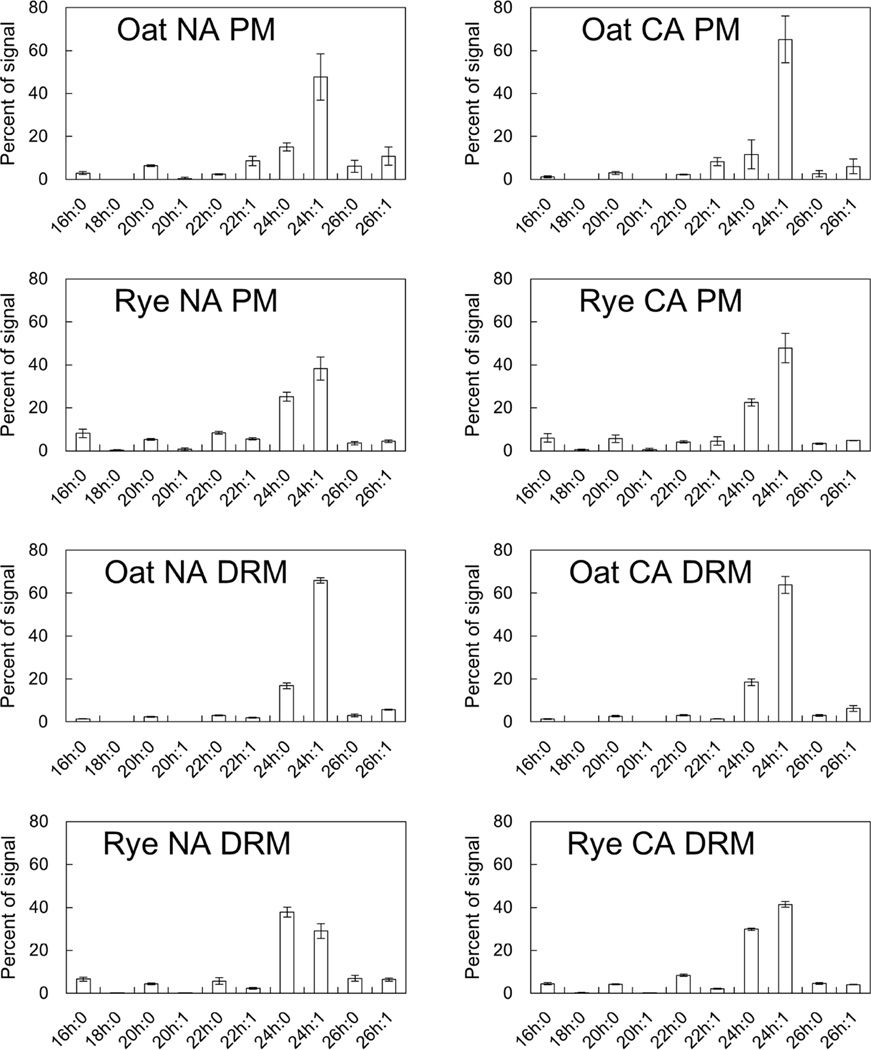
Fig. 6. Compositions of 2-hydroxy fatty acids of GlcCer in PM and DRM fractions.
Compositions of 2-hydroxy fatty acids of GlcCer in PM and DRM were quantified by LC-MS/MS analysis. Y-axis of the graph indicates proportions of signals derived from each 2-hydroxy fatty acid in total GlcCer signals. Error bars indicate standard deviations (n=3).

