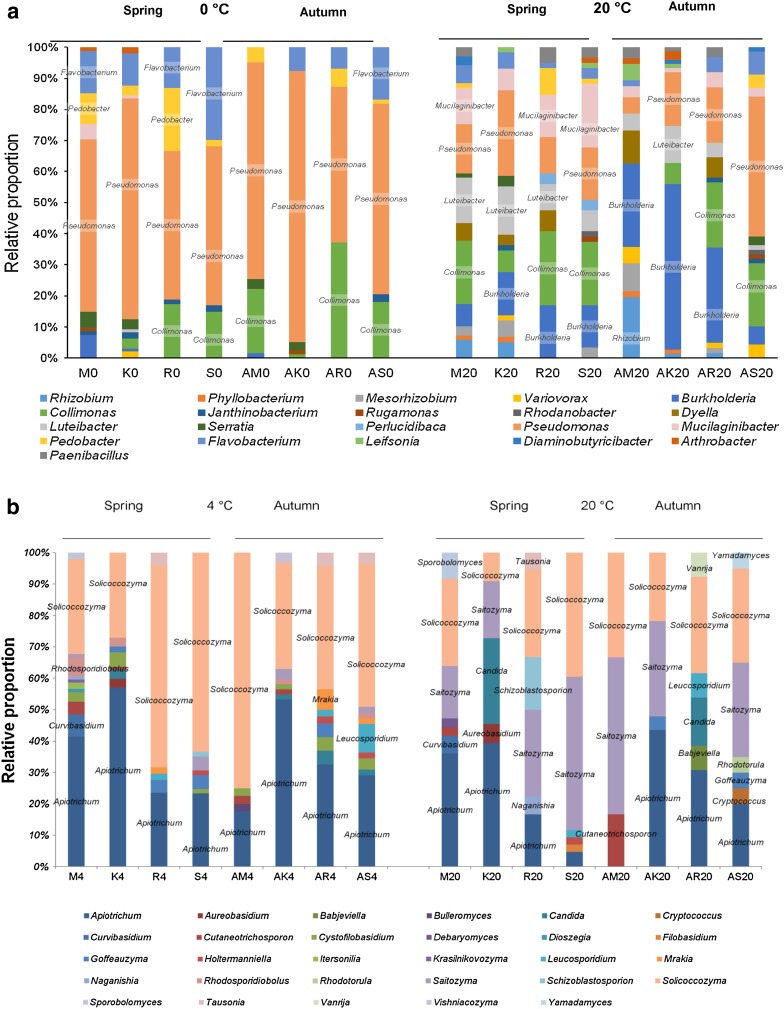
Fig. 2.
Relative proportions of the different bacterial genera isolated at 0 and 20 °C (a) and of the different yeast genera isolated at 4 and 20 °C (b) in spring and autumn. Only genera with more than three strains are shown. Dominant taxa present in all data subsets (at each site, in each season and at each isolation temperature) are boxed

