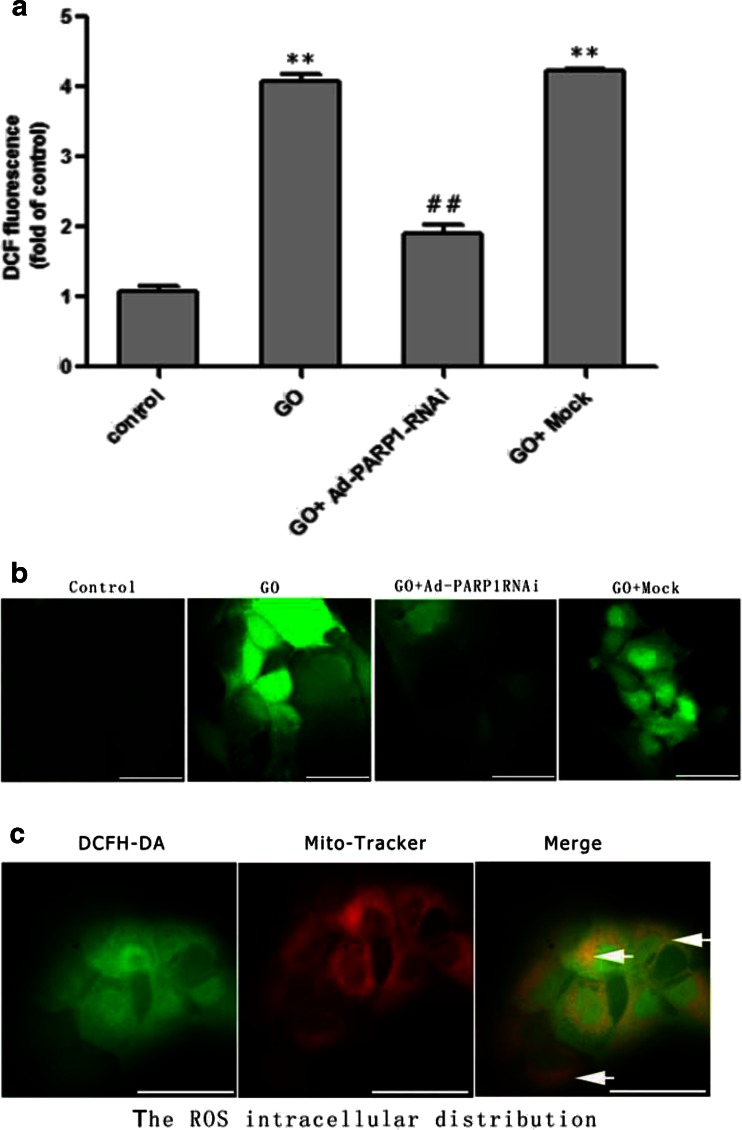
Fig. 4.
Detection of intracellular ROS levels. a, b The ROS accumulation (green fluorescent DCF) in MCs was measured using a fluorescence spectrometer (λex 490 nm, λem 515 nm) and by flow cytometry and fluorescence microscopy. c The distribution of intracellular ROS was detected by co-culturing the cells with MitoTracker (red) and DCFH-DA (green) and then observing them under a fluorescence microscope. **P < 0.01 vs. the control group, ##P < 0.01 vs. the GO group. Data are expressed as the mean + SEM (n = 3). Scale bar = 50 μm

