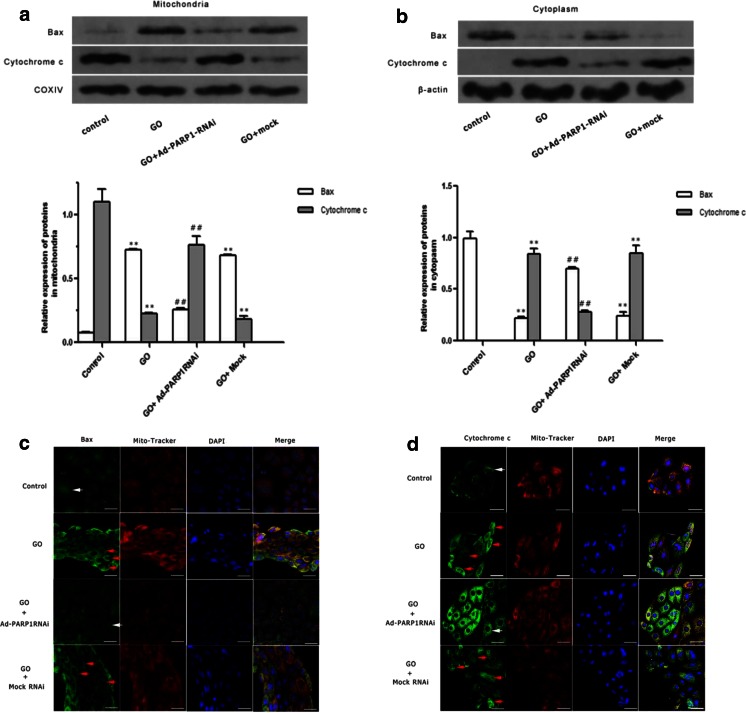
Fig. 7.
Relocation of Bax and CytC. a, b Western blot analysis showed the relative expression of Bax and cytochrome c in the mitochondria and cytoplasm, respectively. c, d The immunofluorescence of Bax, cytochrome c, and MitoTracker and their subcellular distribution during the GO-induced apoptosis of MCs were detected simultaneously by confocal microscopy. Green fluorescence represents Bax and cytochrome c and red fluorescence is indicative of MitoTracker. White arrows show the distribution of Bax and cytochrome c in the control and GO + Ad-PARP1RNAi group cells (c, d). Red arrows indicate the redistribution of Bax and cytochrome c in the GO and GO + mock group cells. The results are given as the mean of three separate experiments. Scale bar = 50 μm

