Fig. 6.
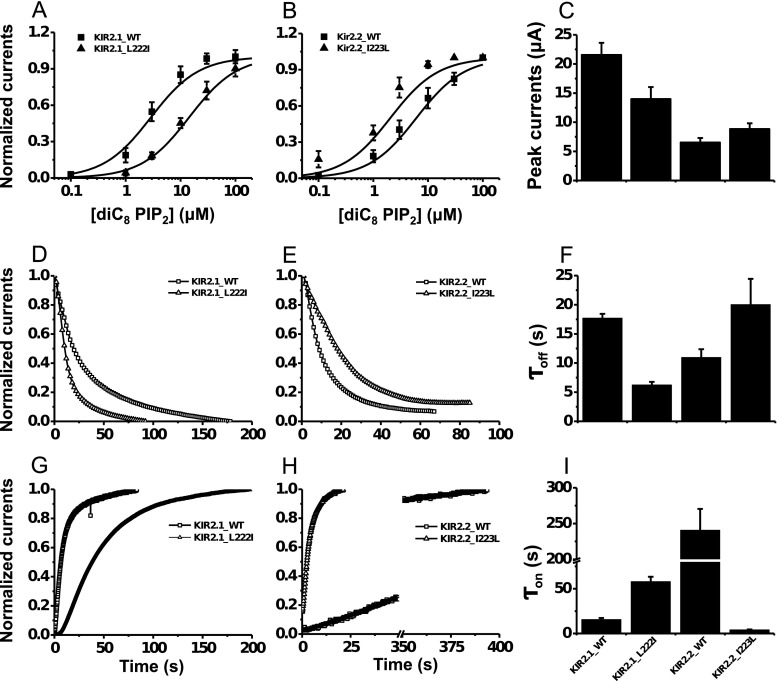
Differences in the gating kinetics of mouse Kir2.1 and human Kir2.2 induced by the mutual mutation of the Ile/Leu site in the CD loop. Dose-response curves (a, b), PIP2 antibody inhibition trace (d, e), and PIP2-induced gating trace (g, h) of the mouse Kir2.1 WT and L222I mutant (a, d, g) and the human Kir2.2 WT and I223L mutant (b, e, h) were experimentally measured. The corresponding summary data of the peak current, the inhibition time constant τ off, and the recovery time constant τ on are provided in c, f, and i, respectively. τ off represents the time needed for the PIP2 antibody to inhibit the Kir channel current to half of its initial amplitude, and τ on represents the time needed for PIP2 to increase the Kir current to half of its maximum amplitude. Solid lines are the Hill fitted lines to the data points of the Kir channels. Each data point is the average of five to six cells from at least three independent experiments. The dose-response curve and all summary data are expressed as the mean ± SE, and the inhibition and activation trace data are shown with only the mean values for clarity

