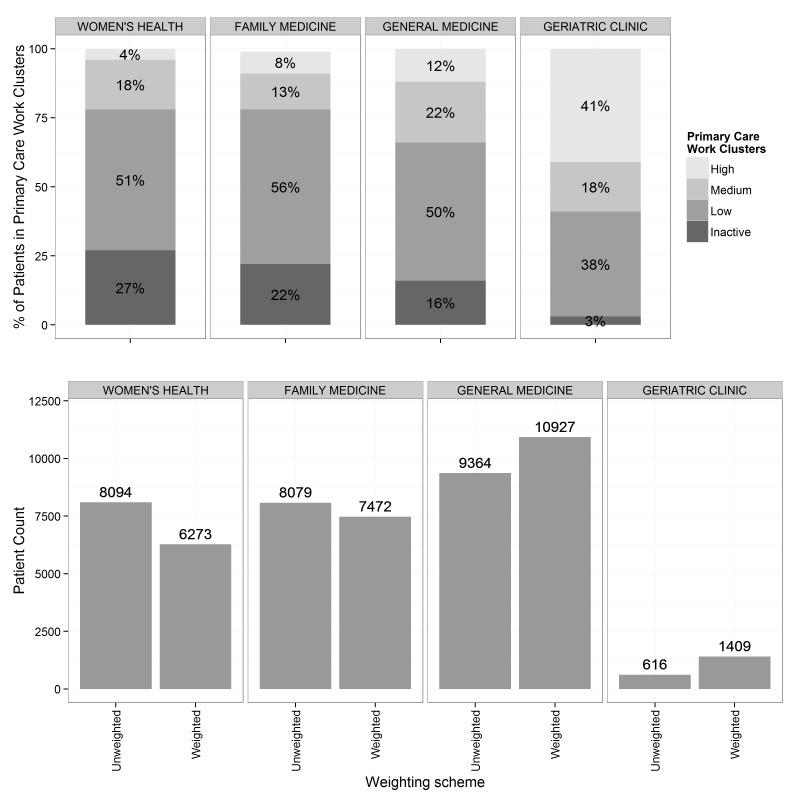
Figure 3.
The fractions of all patients assigned to the primary care work clusters in 4 selected clinics and their unweighted and weighted panel sizes. The distribution of patients across clusters was unique to each clinic, and because each cluster is weighted differently, the difference between weighted and unweighted panel sizes differed for each clinic as well. The geriatric clinic, which has 41% of its population assigned to the high work cluster, had a weighted panel size that was more than twice the unweighted size.

