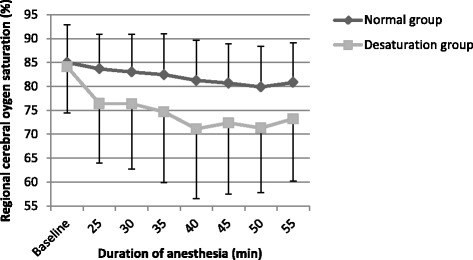
Fig. 1.

Regional cerebral oxygen saturation during anesthesia in normal and desaturation groups (data is shown as mean ± SD). The start of desaturation was observed from the 25th min. Time spam of 55 min includes all patients (8) from desaturation group and 30 patients from normal group (5 patients were excluded by ANOVA because of duration of anesthesia shorter than 55 min). There was a significant difference between normal and desaturation groups (p = 0.041, ANOVA)
