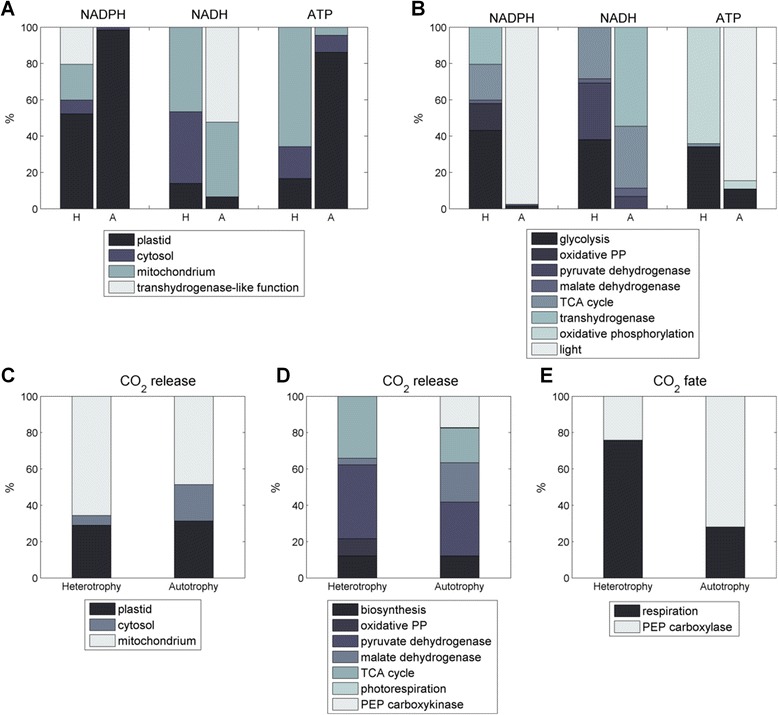
Fig. 6.

Metabolic properties of light and dark metabolism. Metabolic properties of the intracellular flux distributions in the light and in the dark under optimum conditions, respectively, as calculated by elementary flux analysis (average flux values from the top 1 % biomass producing modes, predicted by the EFM simulation. a-b Redox and energy production expressed per total redox and ATP-demand. a Pathway-based subdivision and (b) compartment-based visualization. c-e Details about origin and fate of CO2 as fraction of the total CO2 released. Here, the fluxes were subdivided into different (c) compartments and (d) pathways
