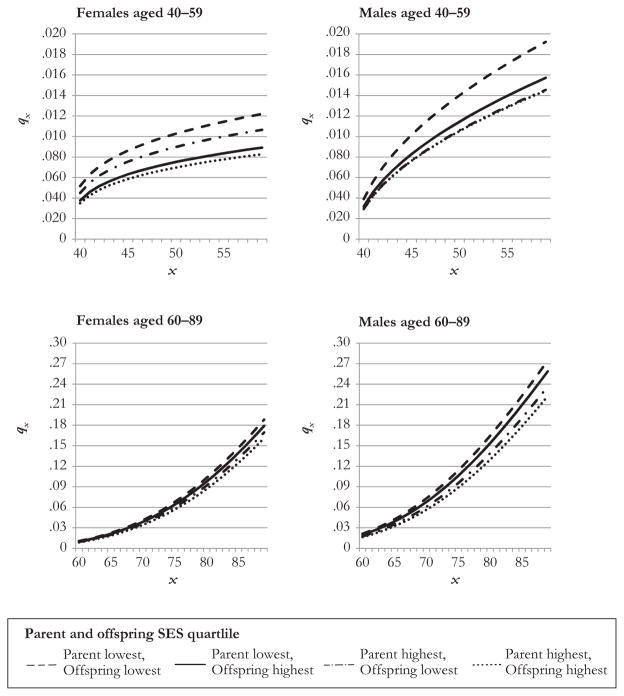
Fig. 2.
Probability of dying (q) at given ages (x) by lowest and highest offspring (G2) SES quartile, conditioned on lowest and highest parental SES (G1), by sex of parent, for age groups 40–59 and 60–90. Calculated from the discrete-time Weibull regression results in Table 5, holding covariates constant at mean values

