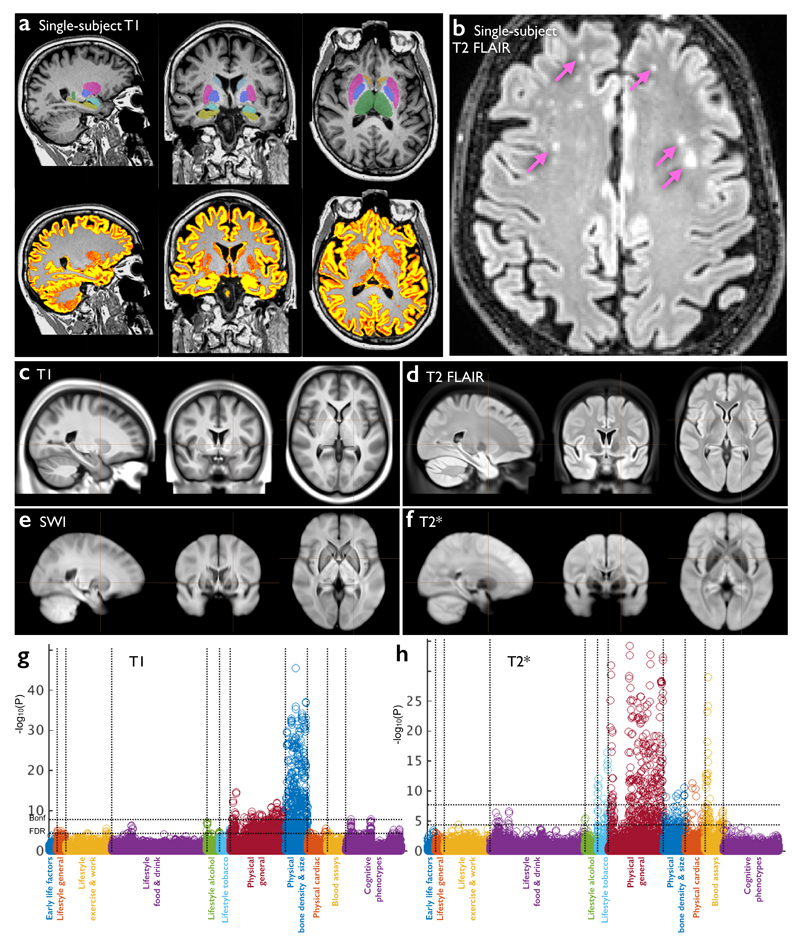
Figure 1. Data from the three structural imaging modalities in UK Biobank brain imaging.
(a) Single-subject T1-weighted structural image with minimal pre-processing: removal of intensity inhomogeneity, lower neck areas cropped and the face blanked to protect anonymity. Color overlays show automated modeling of several subcortical structures (above) and segmentation of gray matter (below). (b) Single-subject T2-weighted FLAIR image with the same minimal pre-processing, showing hyperintense lesions in the white matter indicated (arrows). (c) Group-average (n≈4500) T1 atlas; all subjects’ data were aligned together (see Online Methods for processing details) and averaged, achieving higher quality alignment, with clear delineation of deep grey structures and good agreement of major sulcal folding patterns despite wide variation in these features across subjects. (d) Group-average T2 FLAIR atlas. (e) Group-average atlas derived from SWI processing of swMRI phase and magnitude images. (f) Group-average T2* atlas, also derived from the swMRI data. (g) “Manhattan” plot (a layout common in genetic studies) relating all 25 IDPs from the T1 data to 1100 non-brain-imaging variables extracted from the UK Biobank database, with the latter arranged into major variable groups along the x axis (with these groups separated by vertical dotted lines). For each of these 1100 variables, the significance of the cross-subject univariate correlation with each of the IDPs is plotted vertically, in units of –log10(Puncorrected). The dotted horizontal lines indicate thresholds corresponding to multiple comparison correction using false discovery rate (FDR, lower line, corresponding to puncorrected=3.8×10⁻⁵) and Bonferroni correction (upper line, puncorrected=1.8×10⁻⁸) across the 2.8 million tests involving correlations of all modalities’ IDPs against all 1100 non-imaging measures. Effects such as age, sex and head size are regressed out of all data before computing the correlations. As an indication of the corresponding range of effect sizes, the maximum r2 (fractional variance of either variable explained by the other) is calculated, as well as the minimum r2 across all tests passing the Bonferroni correction. Here the maximum r2 = 0.045 and the minimum r2 = 0.0058. See Online Methods for more details of these analyses. (h) Plot relating all 14 T2* IDPs to 1100 non-imaging variables. Maximum r2 = 0.034, minimum r2 = 0.0063. Marked Bonferroni and FDR multiple comparison threshold levels are the same as in (g).

