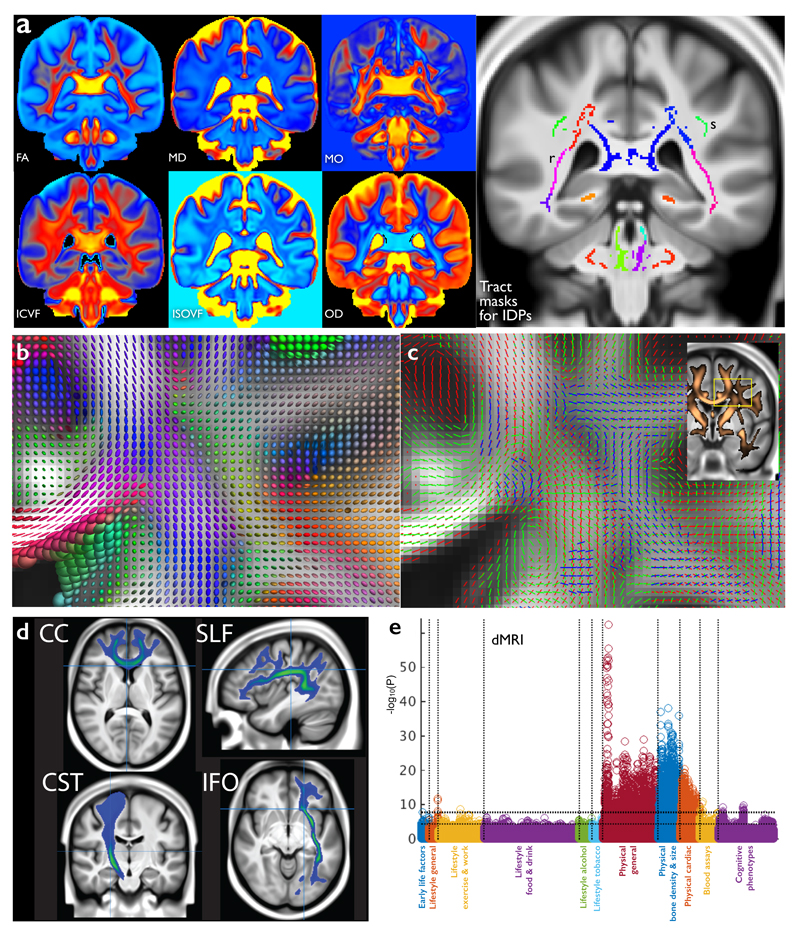
Figure 2. The diffusion MRI data in UK Biobank.
(a) Group-average (n≈4500) atlases from six distinct dMRI modeling outputs, each sensitive to different aspects of the white matter microarchitecture. See Online Methods for processing details. The atlases shown are: FA (fractional anisotropy), MD (mean diffusivity) and MO (tensor mode); ICVF (intra-cellular volume fraction), ISOVF (isotropic or free water volume fraction) and OD (orientation dispersion index), from the NODDI microstructural modeling. Also shown are several group-average white matter masks used to generate IDPs (e.g., pink (r) are retrolenticular tracts in the internal capsules; upper-green (s) are the superior longitudinal fasciculi). (b) Tensor ellipsoids depicting the group-averaged tensor fit at each voxel for the region shown inset in (c). The shapes of the ellipsoids indicate the strength of water diffusion along three principal directions; long thin tensors indicate single dominant fiber bundles, whereas more spherical tensors (within white matter) generally imply regions of crossing fibers (seen more explicitly modeled in corresponding parts of (c)). (c) Group-averaged multiple fiber orientation atlases, showing up to 3 fiber bundles per voxel. Red shows the strongest fiber direction, green the second, and blue the third. Each fiber bundle is only shown where the modeling estimates that population to have greater than 5% voxel occupancy. Inset shows the thresholded mean FA image (copper) overlaid on the T1, with the region shown in detail in (b) and c) highlighted. (d) Four example group-average white matter tract atlases estimated by probabilistic tractography fed from the within-voxel fiber modeling: corpus callosum (genu), superior longitudinal fasciculus, corticospinal tract and inferior fronto-occipital fasciculus. (e) Plot relating all 675 dMRI IDPs (nine distinct dMRI modeling outputs from tensor and NODDI models × 75 tract masks) to 1100 non-imaging variables (see Fig 1g for details). Maximum r2 = 0.057, minimum r2 (passing Bonferroni) = 0.0065. Dotted horizontal lines (multiple comparison thresholds) are the same as in Fig 1g.

