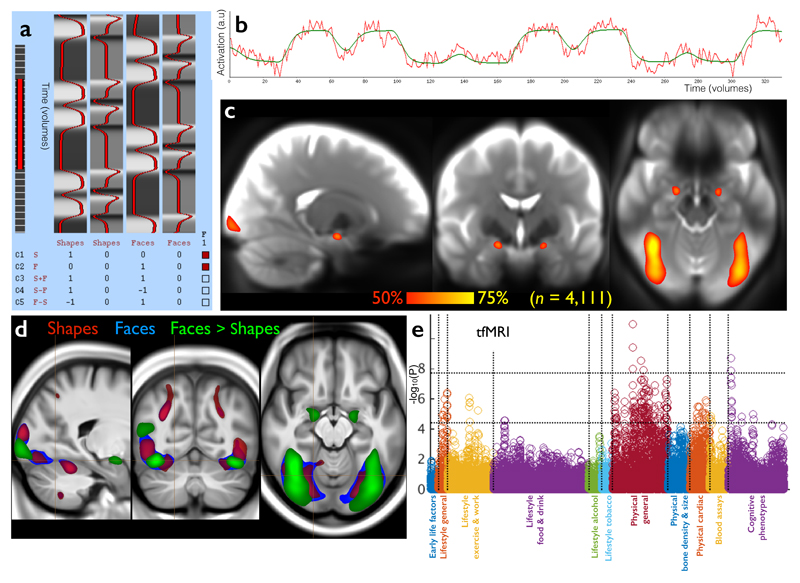
Figure 3. The task fMRI data in UK Biobank.
(a) The task paradigm temporal model (time running vertically) depicting the periods of the two task types (shapes and faces); for more information on this paradigm view, see http://fsl.fmrib.ox.ac.uk/fsl/fslwiki/FEAT/UserGuide. (b) Example fitted activation regression model vs. timeseries data (time running horizontally), for the voxel most strongly responding to the “faces > shapes” contrast in a single subject (Z=12.3). (c) Percentage of subjects passing simple voxel-wise activation thresholding (Z>1.96) for the same contrast. Note reliable focal activation in left and right amygdala. The underlying image is the group-averaged raw fMRI image. (d) Group-averaged activation for the 3 contrasts of most interest, overlaid on the group-average T1 atlas (fixed-effects group average, Z>100, voxelwise Pcorrected<10-30). (e) Plot relating the 16 tfMRI IDPs to 1100 non-imaging variables (see Fig 1g for details). Maximum r2 = 0.018, minimum r2 (passing Bonferroni) = 0.0062. Dotted horizontal lines (multiple comparison thresholds) are the same as in Fig 1g.

