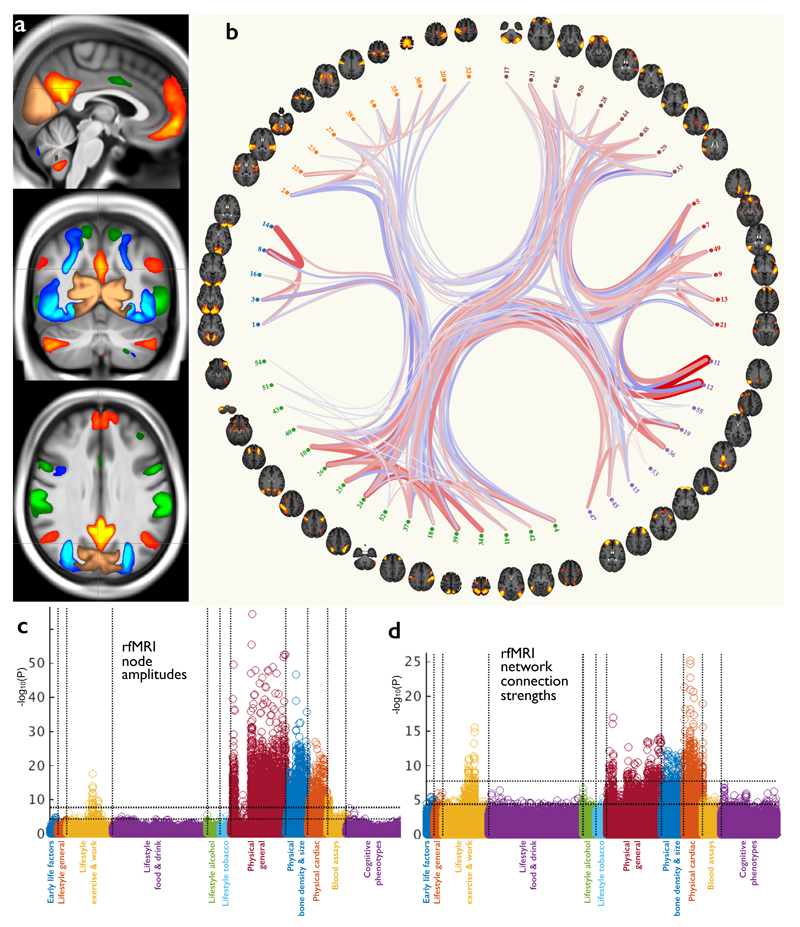
Figure 4. The resting-state fMRI data in UK Biobank.
(a) Example group-average resting-state network (RSN) atlases from the low-dimensional group-average decomposition, showing four out of 21 estimated functional brain networks, including the default mode network (red-yellow), dorsal attention network (green), primary visual (copper), and higher level visual (dorsal and ventral streams, blue). The three slices shown are (top to bottom) sagittal, coronal and axial. (b) The 55 non-artefact components from a higher-dimensional parcelation of the brain (axial views). These are shown as displayed by the connectome browser (www.fmrib.ox.ac.uk/analysis/techrep/ukb/netjs_d100), which allows interactive investigation of individual connections in the group-averaged functional network modeling. The 55 brain regions (network nodes) are clustered into groups according to their average population connectivity, and the strongest individual connections are shown (positive in red, anticorrelations in blue). (c) Plot relating the 76 rfMRI “node amplitude” IDPs to 1100 non-imaging variables (see Fig 1g for details). Maximum r2 = 0.065, minimum r2 (passing Bonferroni) = 0.0059. (d) Plot relating the 1695 rfMRI “functional connectivity” IDPs to 1100 non-imaging variables. Maximum r2 = 0.032, minimum r2 = 0.0059. Dotted horizontal lines (multiple comparison thresholds) in (c) and (d) are the same as in Fig 1g.

