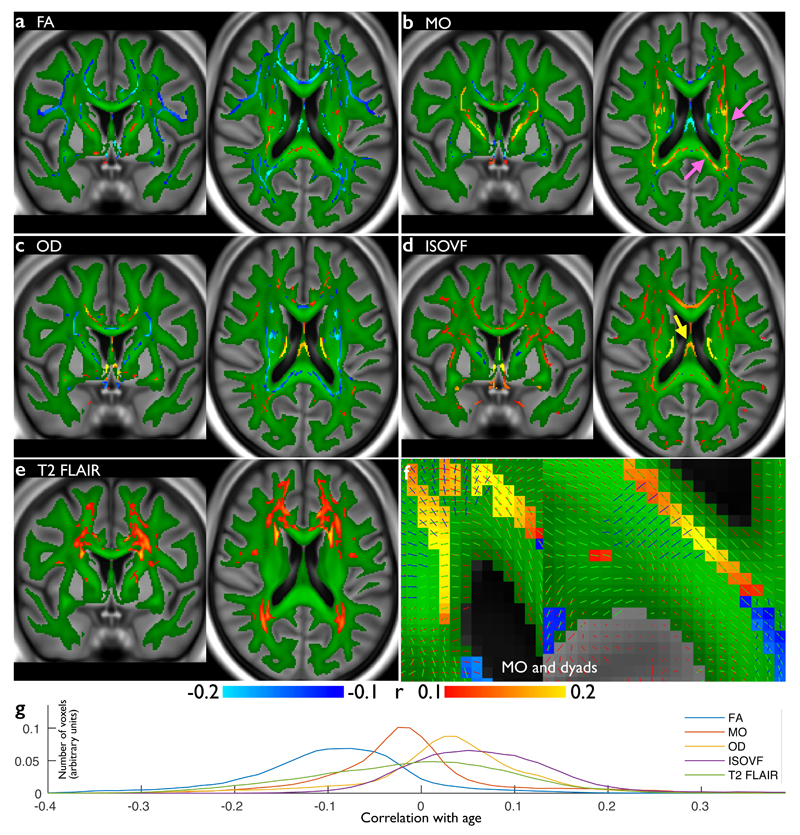
Figure 5. Voxel-wise correlations of participants’ age against several white matter measures from the dMRI and T2 FLAIR data.
(a) Voxel-wise (cross-subject) correlation of FA (fractional anisotropy) vs. age. Group-average FA in white matter is shown in green, overlaid onto the group-average T1. (b) Correlation of MO (tensor mode) vs. age, using the same color scheme. Nearby areas of MO increase are shown in greater detail in (f), which also shows the distinct primary fiber directions. (c) Correlation of OD (orientation dispersion) vs. age, including a reduction in dispersion in posterior corpus callosum. (d) Correlation of ISOVF (isotropic or free water volume fraction) vs. age, showing increases in “free water” with age in a broad range of tracts. (e) Voxel-wise correlation of T2 FLAIR intensity, showing increased intensity with aging in white matter. For (a-e), blue and red-yellow show negative and positive Pearson correlation with age, respectively (Pcorrected<0.05, with Bonferroni correction across voxels resulting in significance at r=0.1 (dMRI n=3722; T2 FLAIR n=3781). (g) Histograms (across voxels) of the voxel-wise age correlation of the correlation maps shown above, with correlation value on the x axis. FA and MO largely decrease with age, while OD and ISOVF largely increase.

