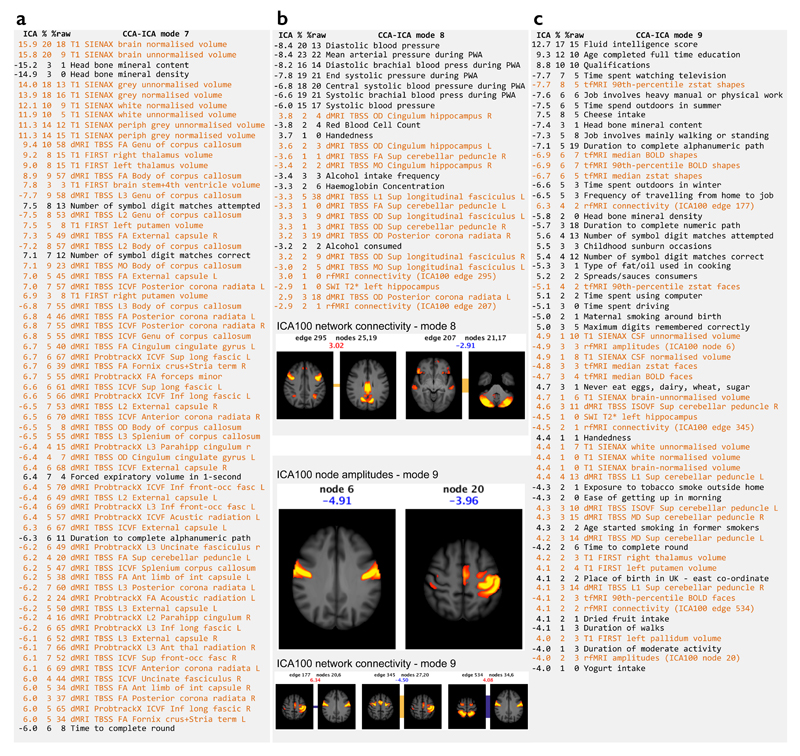
Figure 7. Details of three modes from the doubly-multivariate CCA-ICA analyses across all IDPs and non-brain-imaging variables.
IDPs are listed in orange and non-brain-imaging variables in black. The text lists show the variables most strongly associated with each mode; where multiple very similar (and highly correlated) non-imaging variables are found, only the most significant is listed here for brevity. The first column shows the weight (strength and sign) of a given variable in the ICA mode, the second shows the (cross-subject) percentage variance of the data explained by this mode, and the third column shows the percentage variance explained in the data without the confounds first regressed out. Mode 7 links measures of bone density, brain structure/tissue volumes and cognitive tests. Mode 8 links measures of blood pressure and alcohol intake to IDPs from the diffusion and functional connectivity data; two functional network connections strongly involved are displayed, with the population mean connection indicated by the bar connecting the two nodes forming the connection (red indicates positive mean correlation, blue negative, and the width of the bar indicates the connection strength). The group-ICA maps are thresholded at Z>5, and the colored text is the ICA weight shown in the table list. Mode 9 includes a wide range of imaging and non-imaging variables (see main text for details); as well as showing 3 strong functional network connections, we also show two functional nodes whose resting fluctuation amplitude is associated with this mode.

