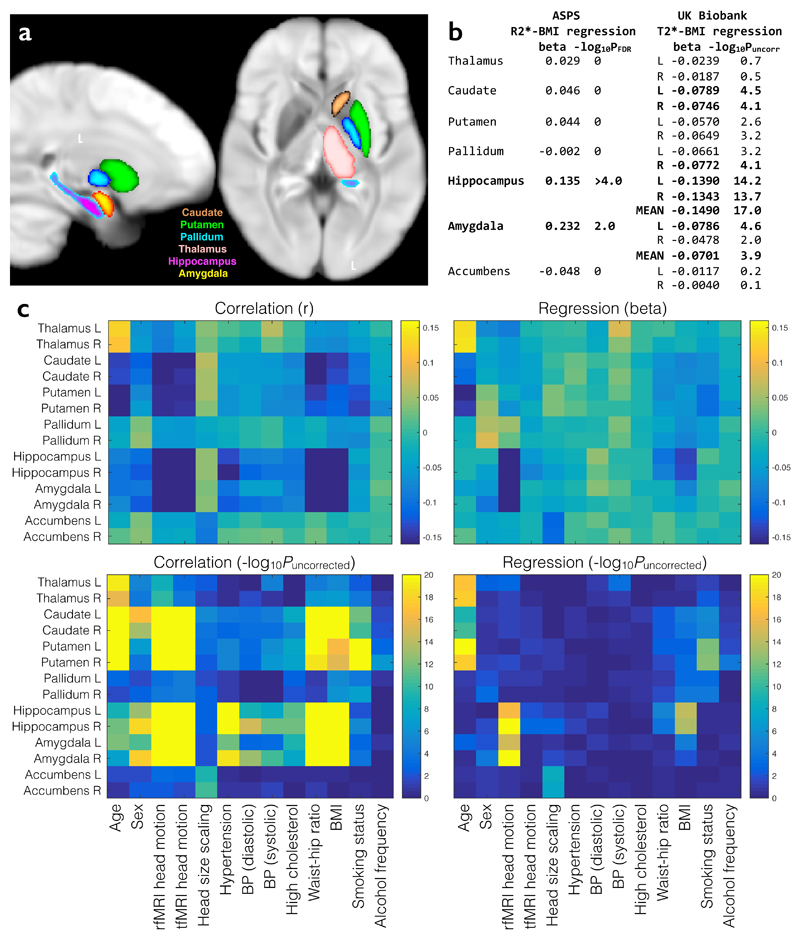
Figure 8. Hypothesis-driven study of age, BMI and smoking associations with subcortical T2*.
(a) UK Biobank population-average map of T2*, overlaid with the main subcortical structures being investigated. The T2* IDPs reflect individuals’ median T2* values within these regions. The relatively low T2* in putamen and pallidum likely reflects greater iron content. (b) BMI regression betas from multiple regressions of R2* (from the ASPS study) and T2* (from UK Biobank) against relevant covariates (see (c)). All variables are standardized so that beta values can be interpreted as (partial) correlation coefficients. R2* significance is reported as FDR-corrected P. T2* significance is reported as –log10Puncorrected with the more conservative Bonferroni correction (for Pcorrected=0.05) resulting in a threshold here of 3.6. (c) Full set of univariate and multiple regression betas and significance values for all brain regions tested and all model covariates. The regression results are much sparser, reflecting the higher associational specificity obtained by reporting unique variance explained.

