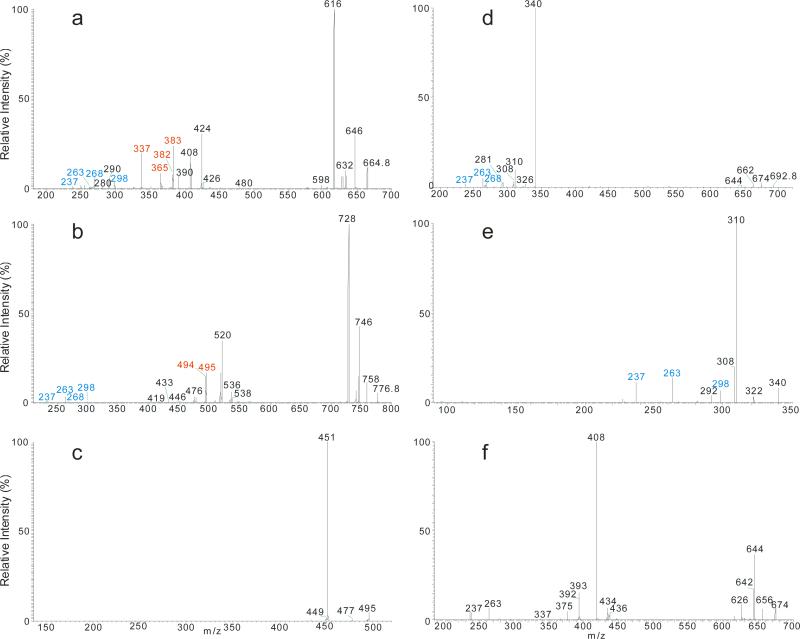
Figure 4.
The MS2 spectrum of the [M – H]− ions of d18:1/h24:0-Cer at m/z 664 (a), of d18:1/ω32:0-Cer at m/z 776 (b), and it MS3 spectrum of the ions of m/z 495 (776 → 495) (c); and the MS2 spectrum of the [M – H]− ions of d18:1/βh26:0-cer at m/z 692 (d), its MS3 spectra of the ion of m/z 340 (692 → 340) (e), and of m/z 674 (692 → 674) (f). The MS3 spectra of m/z 340, and m/z 674, are identical to the MS2 spectra of the [M - H]− ions of d18:1/2:0-Cer, and d18:1/26:1-Cer respectively, leading to define the d18:1/βh26:0-Cer structure (see Scheme 7 for detail).

