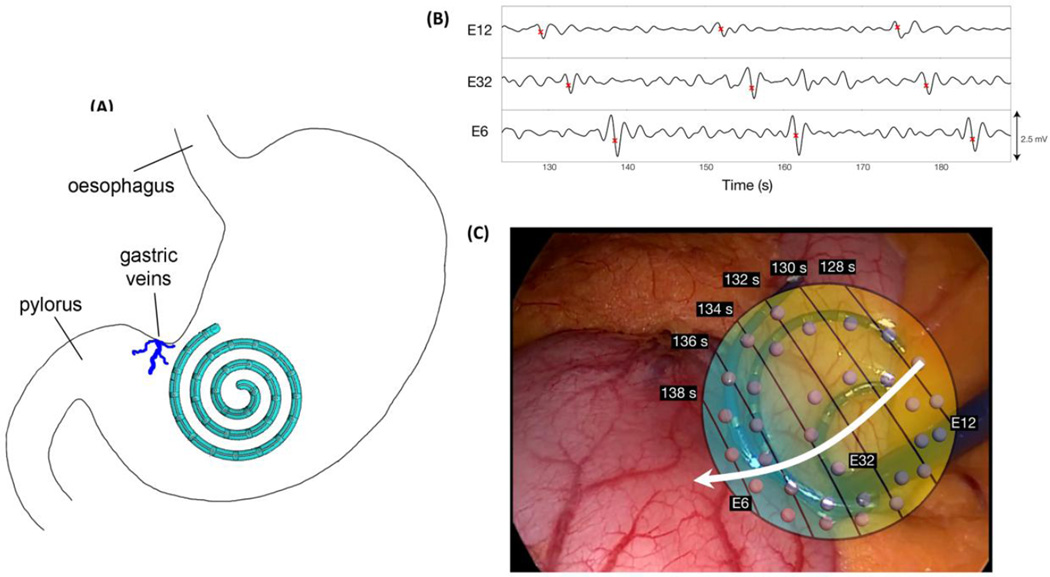
Figure 5.
Example electrode traces and AT map constructed from human intraoperative data. (A) Positioning of the laparoscopic device on the stomach during data collection. (B) The electrograms from three recording channels (numbers displayed), with three slow wave events occurring within the displayed period of 60 seconds (frequency 2.7 ± 0.03 cpm). (C) The resultant activation map has been overlayed on an interoperative image of the laparoscopic device. The electrode positioning relates to that indicated in A. The white arrow indicates the direction of the propagating slow waves in an aboral direction.

