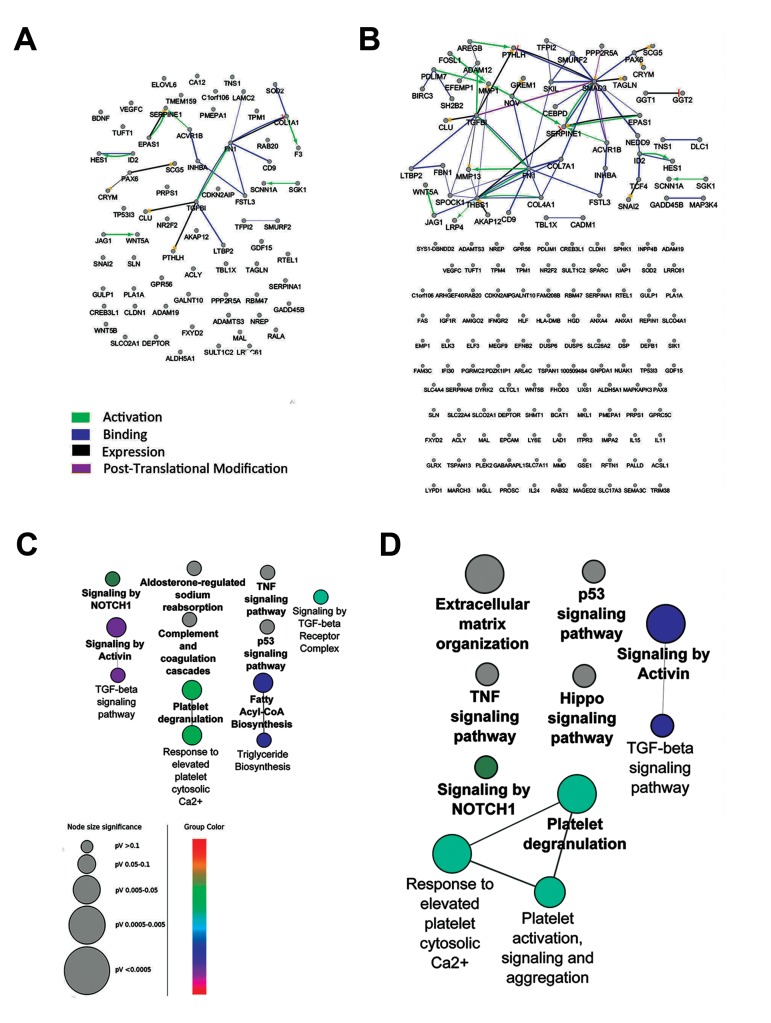
Fig.1.
Interaction networks of the DE genes in the microarray dataset were poor and few signaling pathways were enriched. The expression profiles of human kidney cells treated with TGFβ-1 for 24 or 48 hours were compared to untreated cells. The interaction networks of the differentially expressed genes in the time points of A. 24 hours and B. 48 hours have few edges. In addition, pathway enrichment analysis of these genes in C. 24 hours and D. 48 hours could not detect key signaling pathways. Pathways with adjusted P≤0.05 are shown. Color represents the gene ontology (GO) term level.
TGFβ-1; Transforming growth factor Beta-1 and DE; Differentially expressed.

