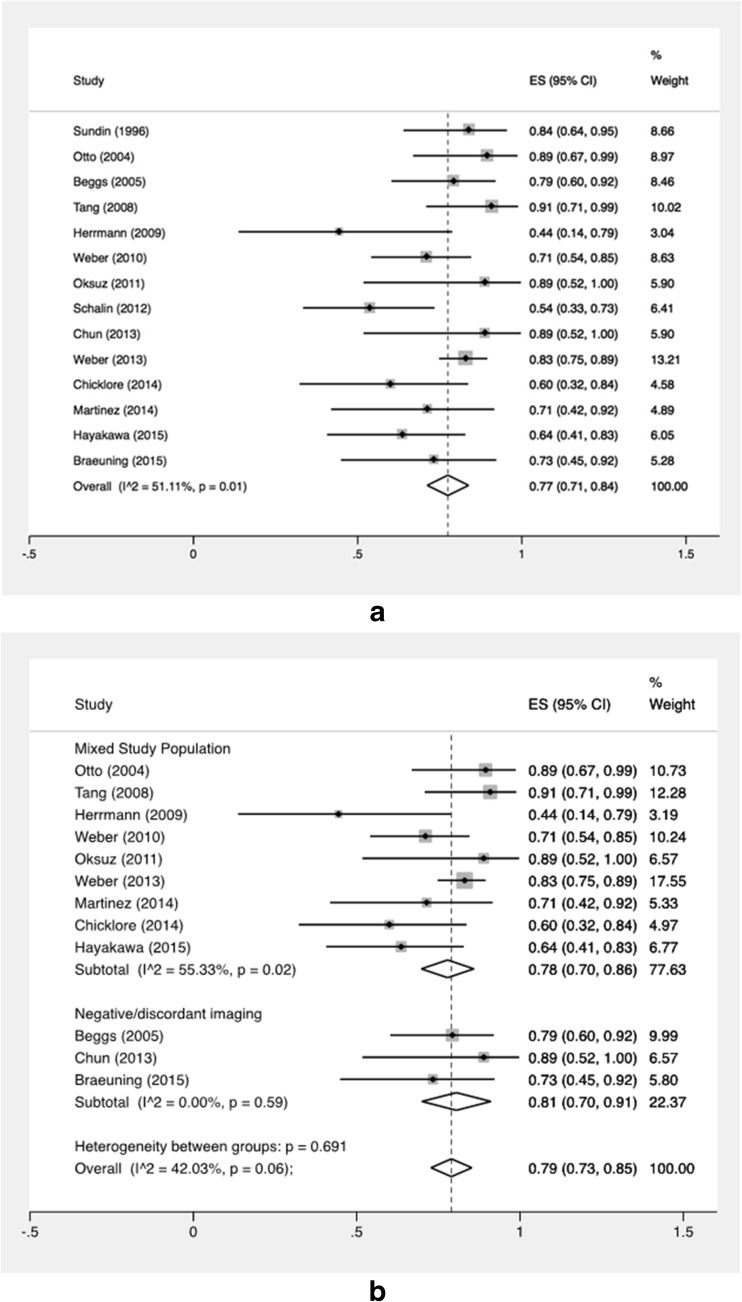
Fig. 4.
a Forest plot of sensitivity of all studies. The pooled result is displayed by the vertical line. Horizontal lines indicate the 95 % confidence intervals of each separate study. Size of the square is directly linked to the number of patients included in the study. b Forest plot of sensitivity of subgroup-analysis depending on domain of included patients. The pooled result is displayed by the vertical line. Horizontal lines indicate the 95 % confidence intervals of each separate study. Size of the square is directly linked to the number of patients included in the study. SE sensitivity, CI confidence interval

