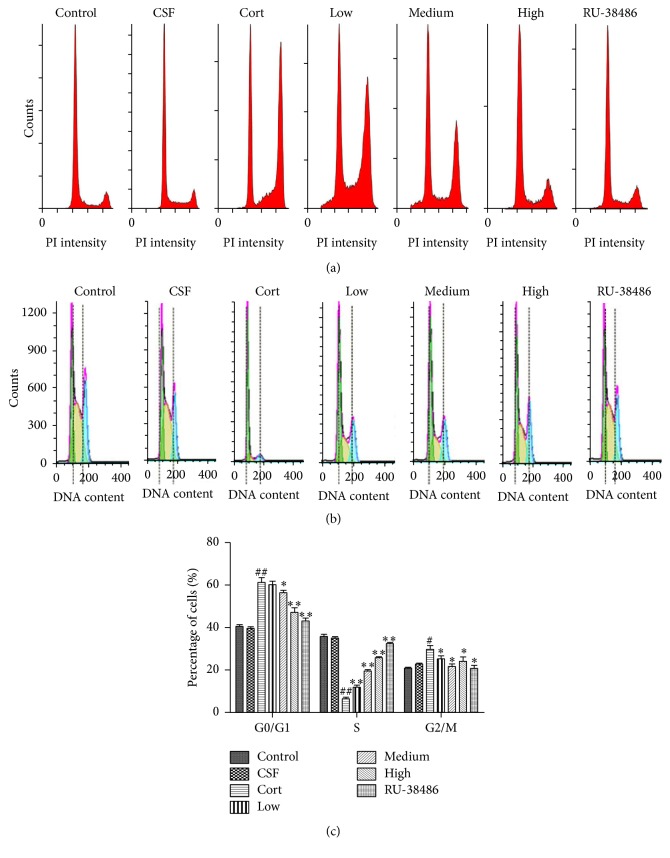
Figure 2.
The effects of XYS on cell survival rate and cycle. (a) The effect of XYS on cell survival rate using flow cytometry detection. (b) The effect of XYS on cell cycle using flow cytometry detection. (c) Data analysis of the effect of XYS on cell cycle (n = 3; # P < 0.05 versus CSF; ## P < 0.01 versus CSF; ∗ P < 0.05 versus Cort; ∗∗ P < 0.01 versus Cort).

