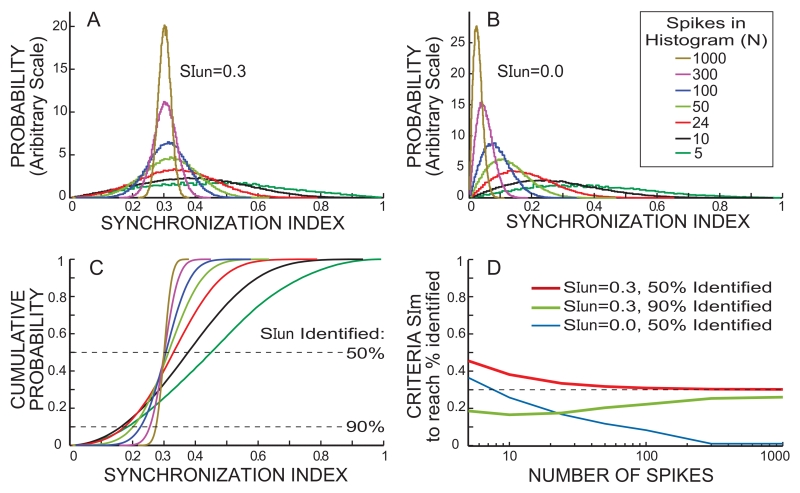
Fig. 3.
Results from simulating spike-response cycle histograms. A & B: Synchronization-Index (SI) probability for cycle histograms with “N” spikes generated with an underlying synchronization index (SIun) of 0.3 (A) or 0.0 (B) (color key in B also applies to A-C). C: SI cumulative distributions from the probabilities in A. D: Lines showing the measured SI (SIm) values needed to achieve the SIun identification rates in the key, as functions of the number of spikes in the cycle histogram.
Cycle histograms of spike data with an underlying modulation of SIun were generated by simulations consisting of series of Bernoulli trials in which either 0 or 1 spike was added to a 10-μs duration bin in histograms that spanned the 20 ms bias-tone period. The probability that a spike was added was sinusoidally modulated across the entire time span of the bins so as to achieve SIun if there were an infinite number of trials. In a single cycle-set, each bin received one independent trial. The baseline (unmodulated) probability of the Bernoulli trials was chosen so that on each cycle-set the total number of spikes in the cycle histogram increased by ~1 spike, on average. Full cycle-sets were repeated until the total number of spikes in all bins reached “N”, the desired total number of spikes. The SI of the resulting cycle histogram was calculated as in Stankovic and Guinan (2000). For each N, this process was done 100,000 times which yielded the distribution of SI’s that result from a processes with a given SIun (e.g. panels A and B).

