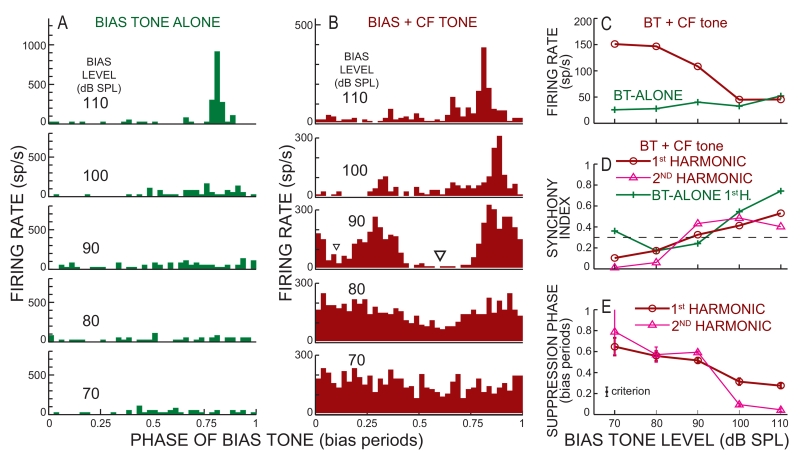
Fig. 4.
Example BT-alone and BT-on-tone data. Period histograms from: (A) a BT-alone sound level series, and (B) a 32 dB SPL CF tone along with BT tones at 70-110 dB SPL. In B, the triangle shows the level and phase of criterion suppression. C-E: BT sound-level series of: (C) average firing rate, (D) Synchronization Index (SI), and (E) the phase of the major suppression. The dashed line in D shows the target SI. Error bars in E show 95% confidence intervals. Data from cat 31, unit 70, CF 2.69 kHz, spontaneous rate (SR) 32.5 sp/s.

