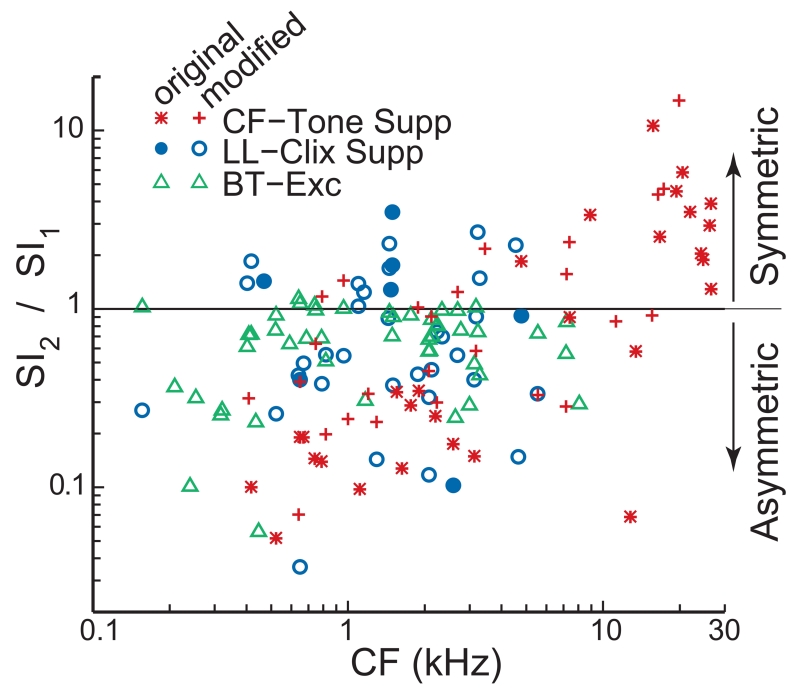
Fig. 8.
The ratio of the synchronization index (SI) of the 2nd harmonic (SI2) to the SI of the 1st harmonic (SI1) at threshold vs. fiber CF. The top-left key gives the symbols for BT suppression of CF-tone responses, BT suppression of low-level click responses, and BT-alone excitation. Lower-ratio values indicate more asymmetrical locations of the operating point on the mechano-electric transduction (MET) function. Note that suppression ratios show OHC MET symmetry while excitation ratios show IHC MET symmetry.

