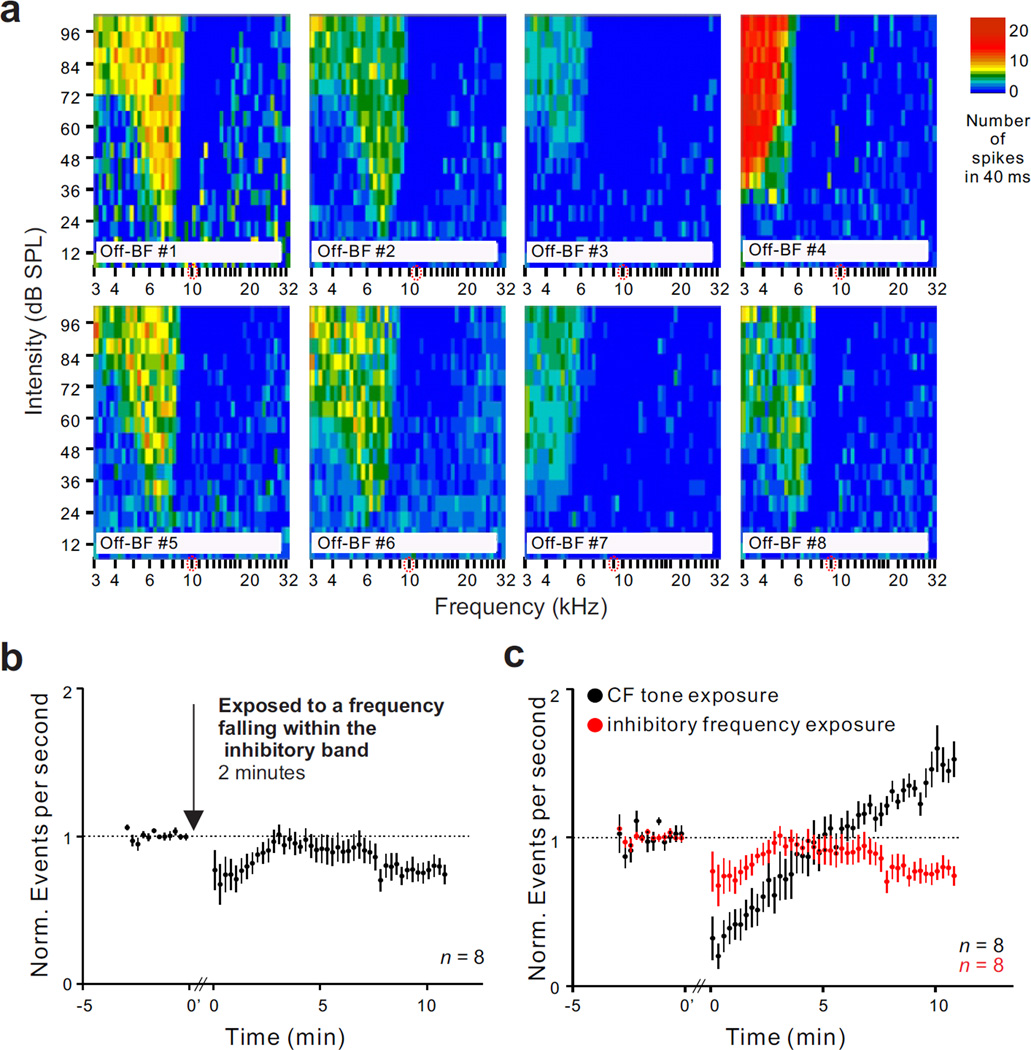
Figure 5.
Effect of tone exposure on single unit spontaneous activity when the frequency of the exposure tone (10 kHz) fell within the unit’s inhibitory side band. (a) Response maps for each of 8 type III units, showing the tuned excitatory areas and their flanking inhibitory side bands (areas in which spontaneous activity was absent). (b) Normalized time course of mean spontaneous activity change averaged across the 8 type III units shown in panel a. Tone exposure duration and intensity were two minutes and 109 dB SPL, respectively. c) Differences of the long-term activity changes following the tone exposure to different frequencies. Dashed lines in b and c indicate baseline activity before and after sound exposure.

