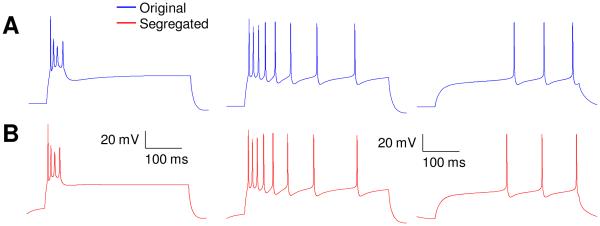
Figure 4.
Responses to 400 ms duration current injections for both original and segregated models of the three distinct hippocampal CA3 cell types in example case 1 (Hemond et al. 2008). Upper trace is for the original model and lower one for the same model after segregation and minor re-tuning of some ionic conductances. Left: burst-firing neuron, 1.53 nA. Middle: adapting neuron, 1.37 nA. Right: weakly-adapting neuron, 0.583 nA.

