. 2016 Oct 25;16(5):286–295. doi: 10.4110/in.2016.16.5.286

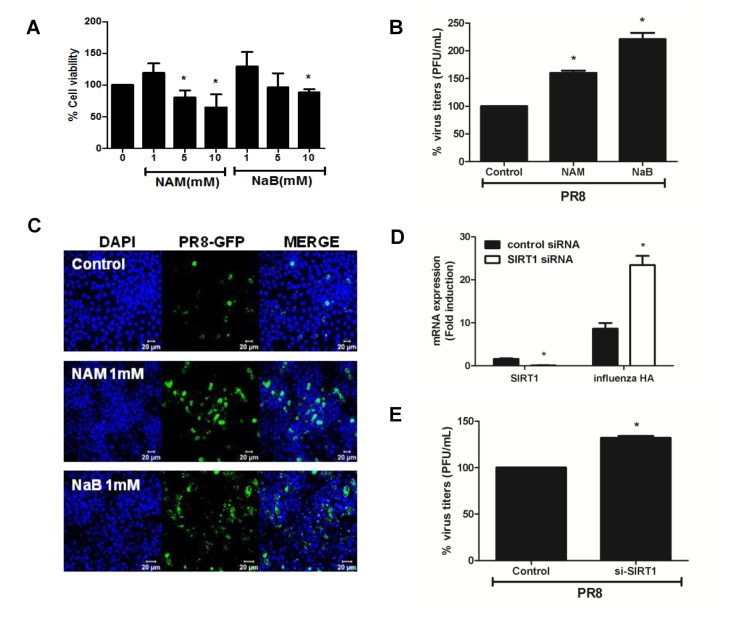
Figure 4. Antiviral effect of anti-senescence gene SIRT1. (A) A549 cells were treated with 3 concentrations (1, 5, and 10 mM) of SIRT1 inhibitor nicotinamide (NAM) and class I HDAC inhibitor sodium butyrate (NaB) for 24 h, after which cell viability was measured using the MTT assay. Data are shown as a percentage (%) of the cell viability of the control cells. The average of 3 independent experiments is shown. Statistical analysis: *p< 0.05 vs. DMSO control-treated group. (B) Cells were treated with 1 mM NAM and 1mM NaB, infected with influenza A PR8 virus, and plaque assay was performed. (C) A549 cells were infected with rPR8-GFP virus (MOI of 1) for 1 h, after which drugs were added in the media for 24 h and GFP expression was monitored by confocal microscopy. Scale bar=20 µM(D) Control or SIRT1-specific siRNA was transfected in A549 cells and the knockdown efficiency was measured by realtime qRT-PCR. SIRT1 mRNA level was greatly reduced upon the mRNA silencing, whereas knockdown of SIRT1 led to upregulation of influenza A hemagluttinin (HA) mRNA expression. Transcript expression levels were calculated in relation to the expression level of GAPDH. Statistical analysis: *p<0.05 compared with virus-infected control siRNA-transfected cells. (E) Plaque assays were performed following SIRT1-specific siRNA transfection in A549 cells. The average of two independent experiments is shown. Statistical analysis: *p <0.05 vs. the control siRNA-transfected cell.

Figure 4