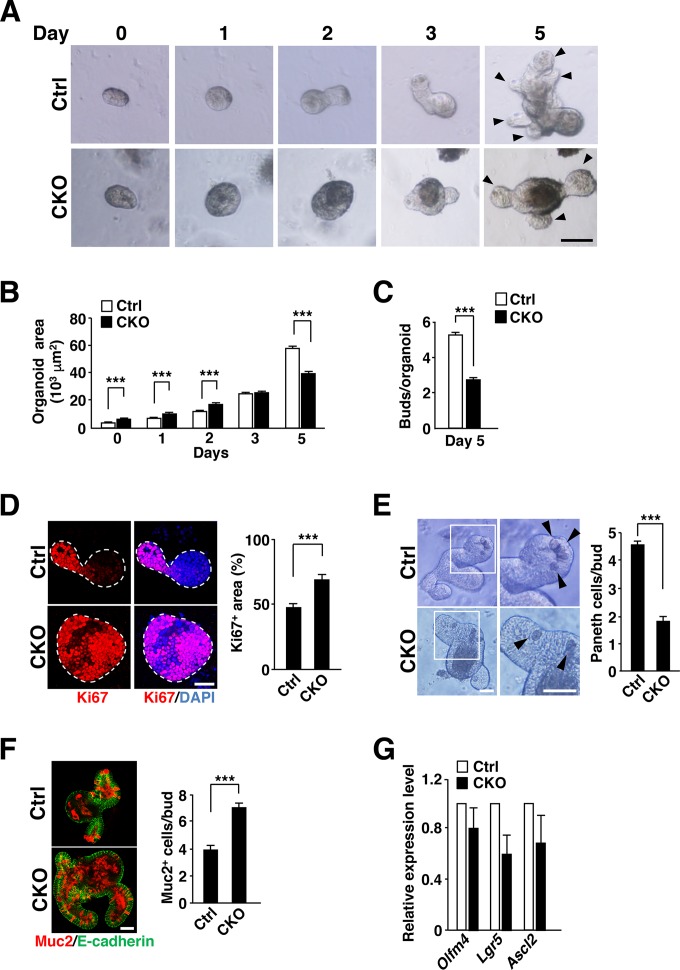
FIG 4.
Increased proliferative activity of IECs in intestinal organoids from Csk CKO mice. (A) Intestinal organoids derived from the jejunum of 8-week-old control or Csk CKO mice were cultured for the indicated times and then examined by light microscopy. Arrowheads indicate cryptlike buds. Scale bar, 100 μm. (B) Area of intestinal organoids cultured as for panel A. (C) Number of buds per organoid for intestinal organoids cultured for 5 days as for panel A. (D) Intestinal organoids cultured for 2 days as for panel A were subjected to immunostaining with antibodies to Ki67 (red) as well as to staining of nuclei with 4′,6-diamidino-2-phenylindole (DAPI) (blue) (left panel). Dashed lines indicate the boundary of intestinal organoids. Scale bar, 100 μm. The Ki67-positive area as a percentage of the total area of each organoid was determined in such images with ImageJ software (right panel). (E) Intestinal organoids were cultured for 3 days as for panel A and then photographed (left panel). Boxed regions in the left images are shown at higher magnification in the right images. Arrowheads indicate granule-containing Paneth cells. Scale bars, 50 μm. The number of granule-containing Paneth cells per bud in such images was also determined (right panel). (F) Intestinal organoids cultured for 3 days as for panel A were subjected to immunostaining with antibodies to mucin 2 (red) and to E-cadherin (green) (left panel). Scale bar, 50 μm. The number of mucin 2-positive cells per bud in such sections was also determined (right panel). (G) Quantitative RT-PCR analysis of Olfm4, Lgr5, and Ascl2 mRNAs in intestinal organoids cultured for 4 days as for panel A. The amount of each mRNA was normalized by that of GAPDH mRNA and then expressed relative to the normalized value for control organoids. Quantitative data are means ± SEM for a total of 75 organoids (B and D), 60 organoids (C), 60 buds (E), or 45 buds (F) per group in three separate experiments or for three separate experiments (G). ***, P < 0.001 (Student's t test).

