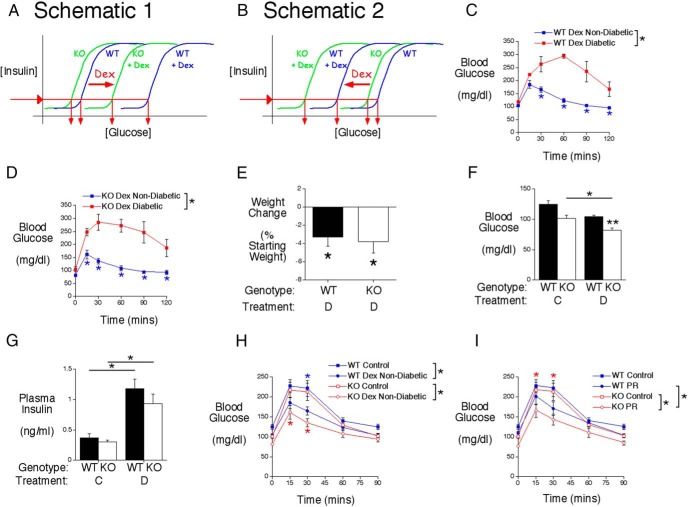
Figure 4.
G6pc2 modulates the effect of Dex on FBG and glucose tolerance in 129SvEv mice. A and B, Schematics proposing that the induction of G6pc2 expression by Dex will increase the difference in FBG between fasted WT and KO mice. The diagrams indicate that the actual values of the x-axis (glucose) may be shifted to the right (A) or left (B), relative to those in control mice, depending on the effects of Dex on other aspects of metabolism. In either case, FPI levels are predicted to not differ between WT and G6pc2 KO mice, as observed in control mice. C, Analysis of glucose tolerance using IPGTTs in 6-hour fasted conscious Dex-treated WT 129SvEv mice. Glucose tolerance was significantly different between nondiabetic Dex-treated (n = 12) and diabetic Dex-treated (n = 5) WT mice based on ANOVA and at the indicated time points based on post hoc analyses (*, P < .05). D, Analysis of glucose tolerance using IPGTTs in 6-hour fasted conscious Dex-treated KO 129SvEv mice. Results show the mean ± SEM. Glucose tolerance was significantly different between nondiabetic Dex-treated (n = 10) and diabetic Dex-treated (n = 5) KO mice based on ANOVA and at the indicated time points based on post hoc analyses (*, P < .05). E, Weight change after 4 days of Dex (D) injections in nondiabetic 129SvEv mice (WT, n = 12; KO, n = 10). Results show the mean ± SEM; *, P < .05 vs initial body weight. F, Glucose levels in 6-hour fasted conscious control (C) (WT, n = 14; KO, n = 12) or Dex-treated nondiabetic (D) (WT, n = 12; KO, n = 10) 129SvEv male mice. Results show the mean ± SEM; *, P < .05 vs control KO; **, P < .05 vs matching WT. G, Insulin levels in 6-hour fasted conscious control (C) (WT, n = 11; KO, n = 10) or Dex-treated nondiabetic (D) (WT, n = 7; KO, n = 6) 129SvEv male mice. Results show the mean ± SEM; *, P < .05 vs control WT or KO. H, Analysis of glucose tolerance using IPGTTs in 6-hour fasted conscious control (WT, n = 14; KO, n = 12) or Dex-treated (WT, n = 12; KO, n = 10) 129SvEv mice. Results show the mean ± SEM. Glucose tolerance was significantly different between control and nondiabetic Dex-treated WT mice and control and nondiabetic Dex-treated KO mice based on ANOVA and at the indicated time points based on post hoc analyses (*, P < .05). I, Analysis of glucose tolerance using IPGTTs in 6-hour fasted conscious control (WT, n = 14; KO, n = 12) or physically restrained (PR) (WT, n = 8; KO, n = 10) 129SvEv mice. Results show the mean ± SEM. Glucose tolerance was significantly different between control and physically restrained KO mice and between physically restrained WT and KO mice based on ANOVA and at the indicated time points based on post hoc analyses (*, P < .05).

