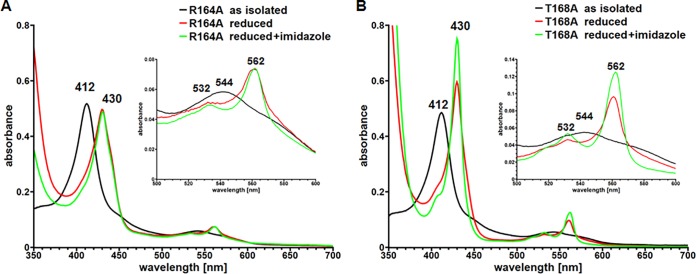
FIG 3.
UV-vis spectra of purified LcpK30 R164A and LcpK30 T168A. UV-vis spectra of purified R164A (A) and T168A (B) were recorded in the as-isolated state (black lines), in the dithionite-reduced state (red lines), and in the dithionite-reduced state to which 10 mM imidazole had been added (green lines). The Q band region between 500 and 600 nm is shown in an enlarged form in the insets. The wavelengths of the absorption maxima are indicated. Notably, no increase in the Soret band was observed for the R164A mutein, indicating differences in the vicinity of the heme. A significant increase in the absorption of the α-band at 562 nm was observed for the T168A mutein after addition of imidazole to the reduced protein, similar to LcpRr (15), indicating a change from an open to a closed state. For UV-vis spectra of the LcpK30 wild type see Fig. S2 in the supplemental material.

