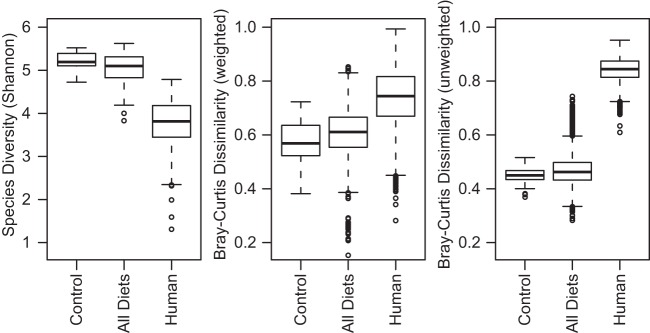
FIG 2.
Alpha and beta diversities among cockroach gut and human fecal samples. Boxplots show Shannon diversity indices (left) and weighted (middle) and unweighted (right) Bray-Curtis dissimilarities among the laboratory cockroaches raised on a dog food diet, all cockroach treatment groups, and human gut microbial communities at the OTU level (97% sequence identity). Human data were obtained from the American Gut Project (22). Cockroach data were trimmed to the same lengths and alignment positions as those from the human gut data prior to OTU calling, and all libraries were resampled to a depth of 4,000 sequences. For each group, the bars delineate the means, the hinges represent the lower and upper quartiles, the whiskers extend to the most extreme values (which are no more than 1.5 times the interquartile range from the box), and outliers are plotted, if present.

