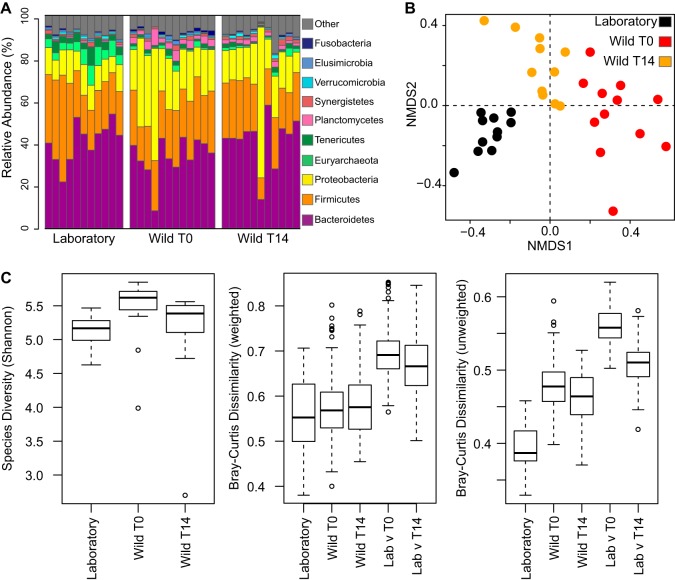
FIG 3.
Comparison of laboratory-raised and wild-caught cockroach gut microbiota. (A) Relative abundances of the 10 most abundant phyla identified among laboratory-raised and wild-caught cockroach gut samples immediately following capture (T0) or after 14 days of culture under laboratory conditions (T14). Each bar represents an individual cockroach gut. (B) Nonmetric multidimensional scaling (NMDS) plot of laboratory-raised and wild-caught cockroaches. PERMANOVA based on dissimilarities was also conducted (R2 = 0.242; P = 0.001). (C) Boxplots comparing Shannon diversity (left) and weighted (middle) and unweighted (right) compositional dissimilarities among the three groups at the OTU level (97% sequence identity). For analyses presented in panels B and C, libraries were sampled to a constant depth of 4,000 sequences. For each group, the bars delineate the means, the hinges represent the lower and upper quartiles, the whiskers extend to the most extreme values (which are no more than 1.5 times the interquartile range from the box), and outliers are plotted, if present.

