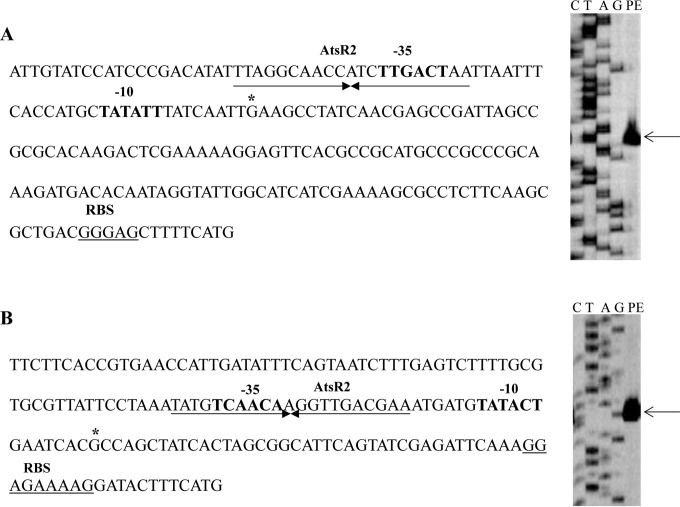
FIG 6.
Schematic representation of the atsR2 (A) and atsT (B) promoter regions. Boldface type and underlining indicate −10 and −35 hexamers (as deduced from the primer extension results) and the ribosomal binding site (RBS); the transcriptional start site is indicated by an asterisk. The arrows below the indicated DNA sequences indicate the inverted repeats that represent the presumed AtsR2-binding site. The arrows in the right panels indicate the primer extension products. C, cytosine; T, thymine; A, adenine; G, guanine; PE, primer extension product.

