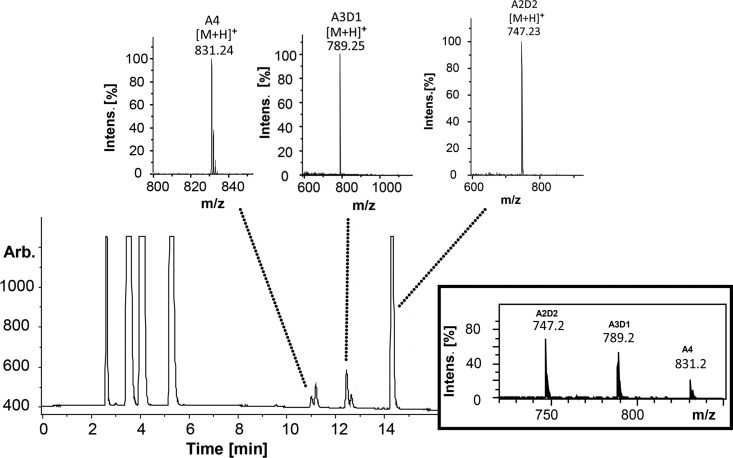
FIG 5.
UHPLC-ELSD-ESI-MS analysis of chitin tetramer (A4) (1 mg · ml−1) treated with PgtCDA (0.6 nmol). The ELSD chromatogram shows the elution of initial buffer peaks (2 to 6 min) followed by target peaks. The m/z ratios in the MS spectra correspond to the mass of the substrate (A4; m/z 831.24), which after incubation with enzyme gives rise to single- and double-deacetylated products A3D1 (m/z 789.25) and A2D2 (m/z 747.23), respectively. A combined spectrum is also attached for an overview. See the supplemental material for the same analysis of chitin pentamer (A5) and hexamer (A6) treated with PgtCDA. intens., intensity; Arb., arbitrary units.

