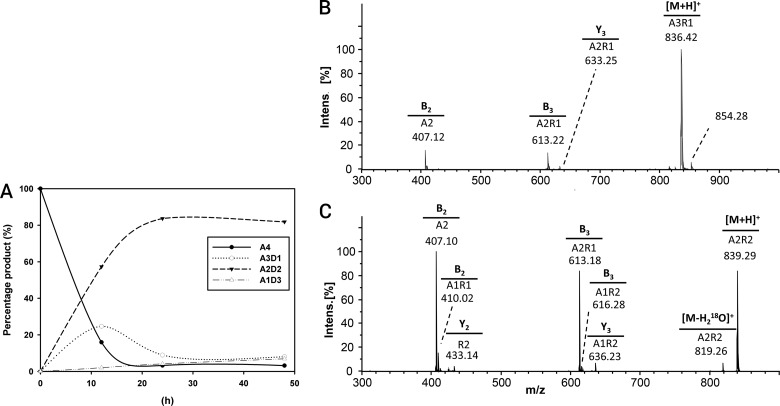
FIG 6.
(A to C) Time curve of deacetylation (A) and hydrophilic interaction liquid chromatography-tandem mass spectrometry (HILIC-MS2) chromatogram of the deacetylation products from PgtCDA (0.6 nmol) incubated with chitin tetramer (A4) (1 mg · ml−1) as the substrate, giving single deacetylation A-A-D-A (B) and then double deacetylation A-A-D-D (C). After incubation with the enzyme for different lengths of time, the products were re-N-acetylated with [2H6]acetic anhydride, 18O-labeled at the reducing ends, followed by UHPLC-ELSD-ESI-MSn. (B and C) The precursor ion m/z values and the MS2 spectra for sequencing the precursor ion are shown. See the supplemental material for the same analysis of chitin pentamer (A5) and hexamer (A6) treated with PgtCDA.

