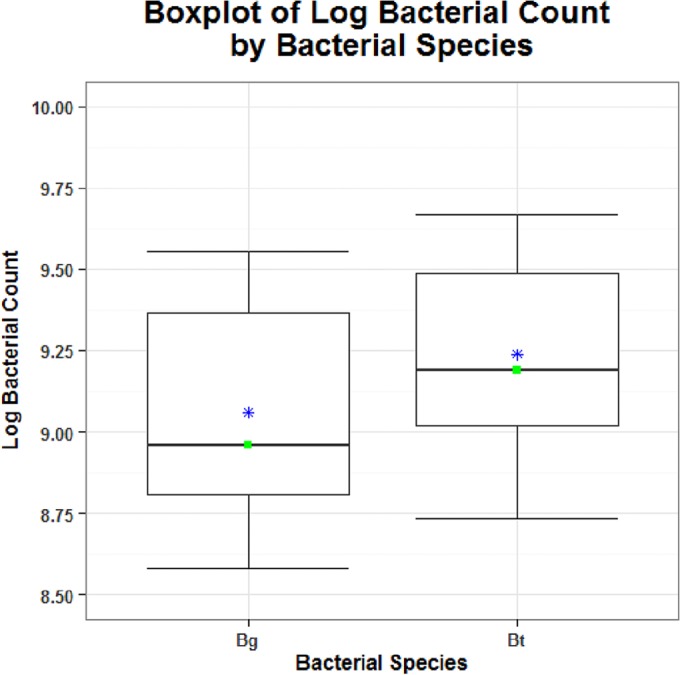
FIG 4.

Box plots of mean levels of bacterial counts for spores of B. atrophaeus subsp. globigii (left) and B. thuringiensis lacking cry genes (right) for all of the witness trays that were replaced at each spray event. Green squares, medians; blue asterisks, average values. The counts are expressed as log CFU per square meter.
