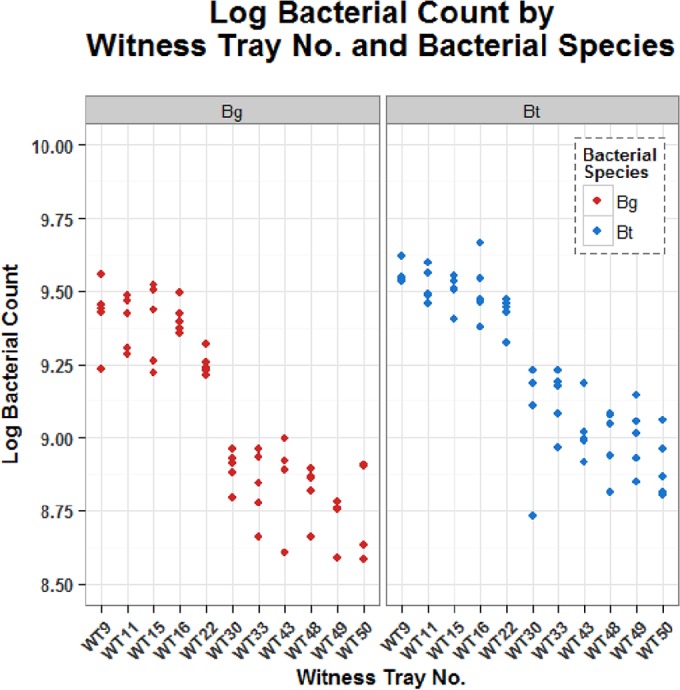
FIG 5.

Mean bacterial counts (expressed as log CFU per square meter) for the spores of B. atrophaeus subsp. globigii (red symbols) and B. thuringiensis lacking cry genes (blue symbols) from each of the witness trays (WT9 to WT50) for each of the five spray events. Each colored symbol represents the count from one of the five spray events (which have not been individually identified). Where fewer than five shapes are visible at any sampling site, it is because two or more of the data points are superimposed.
