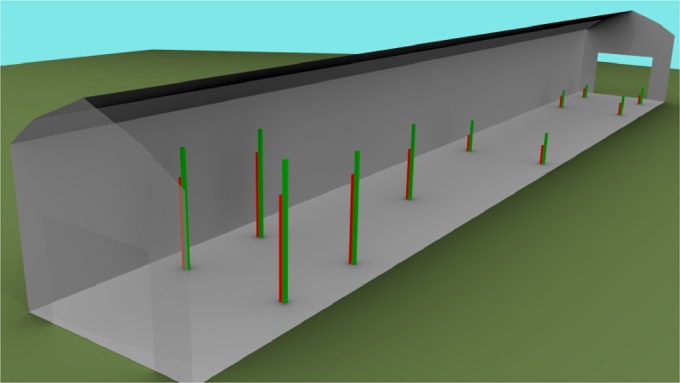
FIG 6.

Graphical representation of the recovery of spores of B. atrophaeus subsp. globigii (red bars) and Btcry− (green bars) from the individual witness trays placed adjacent to the filter samplers. These were replaced after each spray, but the figure represents the overall mean of the releases. The height of each bar from the floor of the barn represents the count measured for that species at that location. The widths of the witness tray columns in the diagram are equivalent to 0.15 m, although the bacterial counts were calculated per square meter. The dimensions of the barn are drawn to scale. The spray source was located at the left end of the barn, as represented here.
